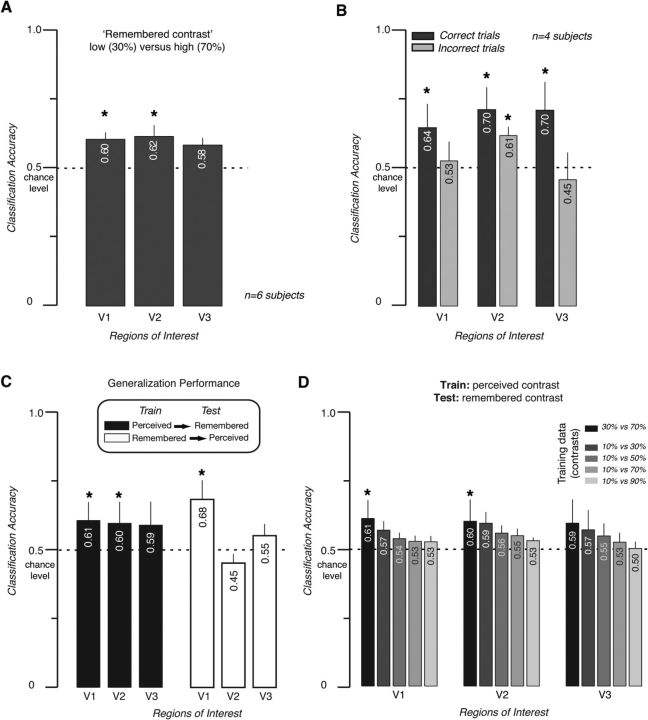
Figure 4.
A, Proportion correct classification (30% contrast vs 70% contrast) from delayed periods in the working memory task. Error bars indicate SEM across subjects. B, Predictions of remembered contrast levels using correct versus incorrect trials. Data were combined across (n = 4) subjects. Error bars indicate SEM across subjects. Colors and dark bars indicate the use of only correct trials; lighter bars, only incorrect trials. C, Generalization performance. Dark gray bars show performance when the classifier from Experiment 1 (perceived contrast) was used to decode which contrast was remembered in Experiment 2 (remembered contrast). Light gray bars show performance generalization by a classifier from Experiment 2 (remembered contrast) to Experiment 1 (perceived contrast). Error bars indicate SEM across subjects. D, Generalization from perceived to remembered stimuli is most consistent when contrast for training and test data are matched (black bars). Error bars indicate SEM across subjects. *p < 0.05, two-tailed t test.

