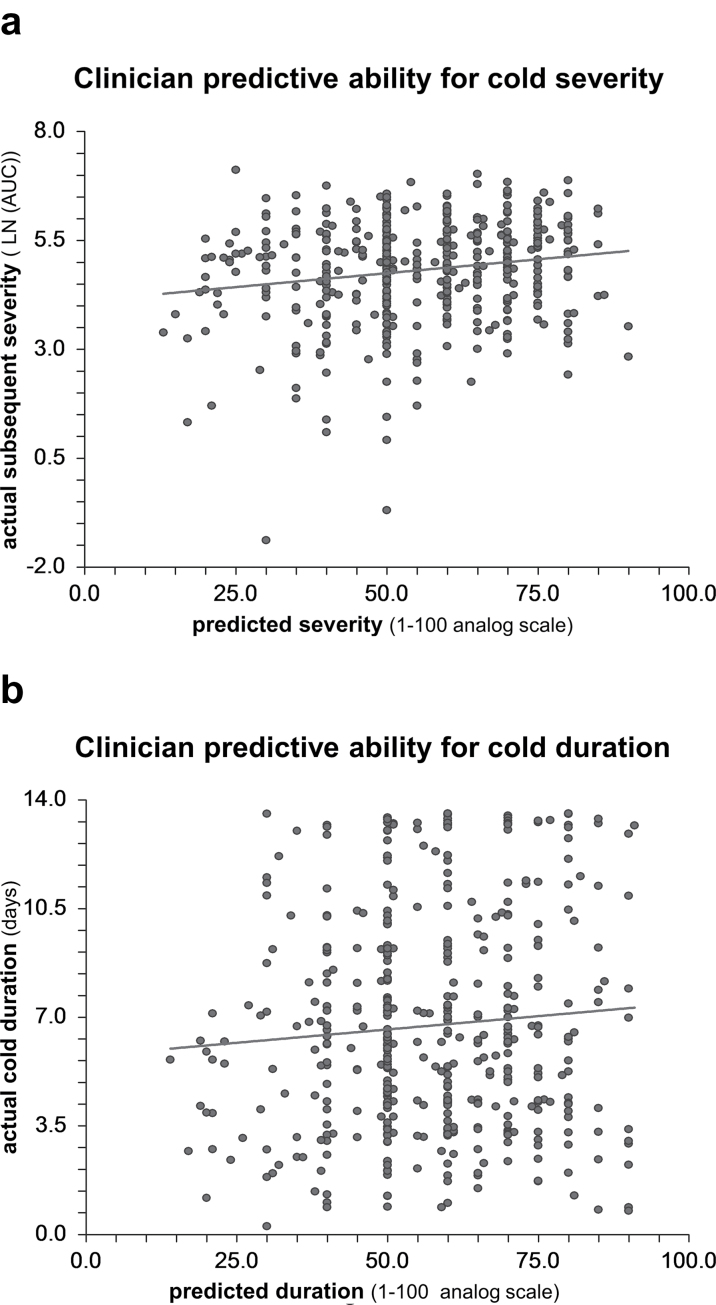
Figure 2.
Scatterplots of relationship between clinician predictions and actual outcomes with linear regression lines (a) Clinician prediction of cold severity on x-axis compared with actual subsequent severity by AUC on y-axis with linear regression line. R 2=0.031 (95% CI: −0.0003–0.062). (b) Clinician prediction of cold duration on x-axis compared with actual duration in days on y-axis with linear regression line. R 2=0.0061 (95% CI: −0.008–0.020).

