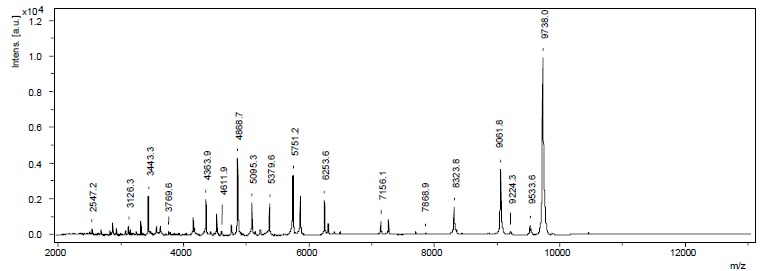
Fig. (1).

Illustration of a typical MALDI-TOF MS spectrum for E. coli. Mass over charge ratios (m/z) are plotted with their corresponding relative intensities. By the parameters and materials we used, mass peaks were generally found up to a m/z of 10.000. Above 10.000 only few samples showed reproducible peaks.
