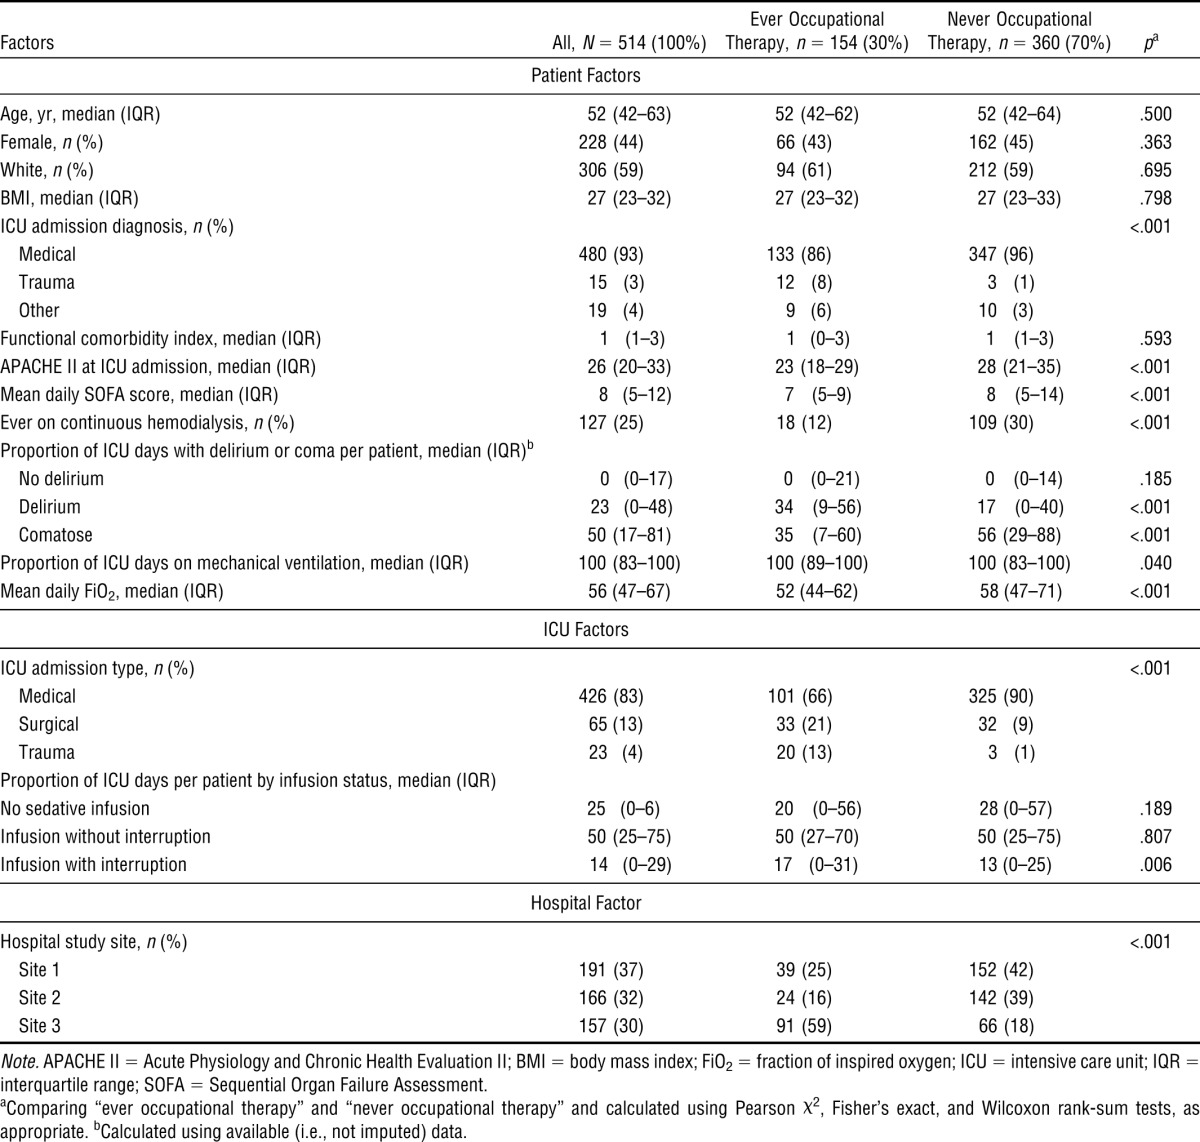
Table 1.
Baseline Characteristics, by ICU Occupational Therapy Status

| Factors | All, N = 514 (100%) | Ever Occupational Therapy, n = 154 (30%) | Never Occupational Therapy, n = 360 (70%) | pa |
| Patient Factors | ||||
| Age, yr, median (IQR) | 52 (42–63) | 52 (42–62) | 52 (42–64) | .500 |
| Female, n (%) | 228 (44) | 66 (43) | 162 (45) | .363 |
| White, n (%) | 306 (59) | 94 (61) | 212 (59) | .695 |
| BMI, median (IQR) | 27 (23–32) | 27 (23–32) | 27 (23–33) | .798 |
| ICU admission diagnosis, n (%) | <.001 | |||
| Medical | 480 (93) | 133 (86) | 347 (96) | |
| Trauma | 15(3) | 12(8) | 3(1) | |
| Other | 19(4) | 9(6) | 10(3) | |
| Functional comorbidity index, median (IQR) | 1(1–3) | 1(0–3) | 1(1–3) | .593 |
| APACHE II at ICU admission, median (IQR) | 26 (20–33) | 23 (18–29) | 28 (21–35) | <.001 |
| Mean daily SOFA score, median (IQR) | 8(5–12) | 7(5–9) | 8(5–14) | <.001 |
| Ever on continuous hemodialysis, n (%) | 127 (25) | 18 (12) | 109 (30) | <.001 |
| Proportion of ICU days with delirium or coma per patient, median (IQR)b | ||||
| No delirium | 0(0–17) | 0(0–21) | 0(0–14) | .185 |
| Delirium | 23(0–48) | 34(9–56) | 17(0–40) | <.001 |
| Comatose | 50 (17–81) | 35(7–60) | 56 (29–88) | <.001 |
| Proportion of ICU days on mechanical ventilation, median (IQR) | 100 (83–100) | 100 (89–100) | 100 (83–100) | .040 |
| Mean daily FiO2, median (IQR) | 56 (47–67) | 52 (44–62) | 58 (47–71) | <.001 |
| ICU Factors | ||||
| ICU admission type, n (%) | <.001 | |||
| Medical | 426 (83) | 101 (66) | 325 (90) | |
| Surgical | 65(13) | 33 (21) | 32(9) | |
| Trauma | 23(4) | 20 (13) | 3(1) | |
| Proportion of ICU days per patient by infusion status, median (IQR) | ||||
| No sedative infusion | 25(0–6) | 20(0–56) | 28(0–57) | .189 |
| Infusion without interruption | 50 (25–75) | 50 (27–70) | 50 (25–75) | .807 |
| Infusion with interruption | 14(0–29) | 17(0–31) | 13(0–25) | .006 |
| Hospital Factor | ||||
| Hospital study site, n (%) | <.001 | |||
| Site 1 | 191 (37) | 39 (25) | 152 (42) | |
| Site 2 | 166 (32) | 24 (16) | 142 (39) | |
| Site 3 | 157 (30) | 91 (59) | 66 (18) | |
Note. APACHE II = Acute Physiology and Chronic Health Evaluation II; BMI = body mass index; FiO2 = fraction of inspired oxygen; ICU = intensive care unit; IQR = interquartile range; SOFA = Sequential Organ Failure Assessment.
Comparing “ever occupational therapy” and “never occupational therapy” and calculated using Pearson χ2, Fisher’s exact, and Wilcoxon rank-sum tests, as appropriate.
Calculated using available (i.e., not imputed) data.
