
Table 1.
Child Characteristics at Baseline, by Treatment Group
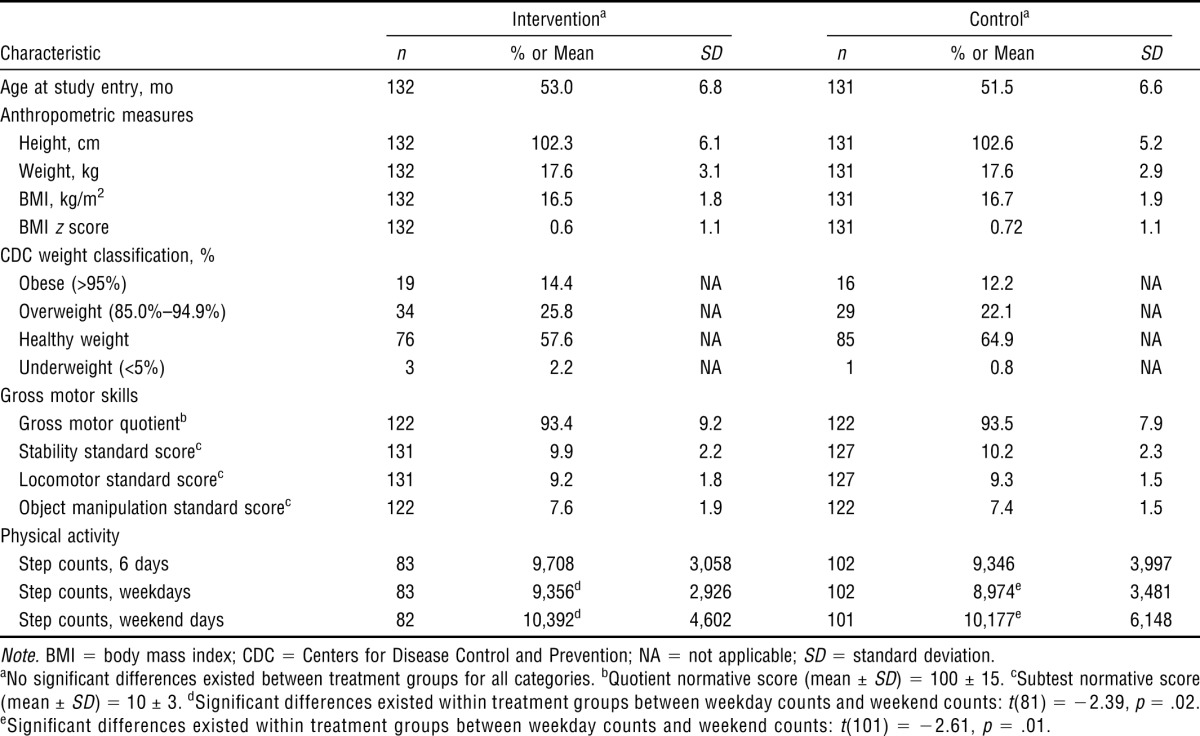
| Interventiona | Controla | |||||
| Characteristic | n | % or Mean | SD | n | % or Mean | SD |
| Age at study entry, mo | 132 | 53.0 | 6.8 | 131 | 51.5 | 6.6 |
| Anthropometric measures | ||||||
| Height, cm | 132 | 102.3 | 6.1 | 131 | 102.6 | 5.2 |
| Weight, kg | 132 | 17.6 | 3.1 | 131 | 17.6 | 2.9 |
| BMI, kg/m2 | 132 | 16.5 | 1.8 | 131 | 16.7 | 1.9 |
| BMI z score | 132 | 0.6 | 1.1 | 131 | 0.72 | 1.1 |
| CDC weight classification, % | ||||||
| Obese (>95%) | 19 | 14.4 | NA | 16 | 12.2 | NA |
| Overweight (85.0%–94.9%) | 34 | 25.8 | NA | 29 | 22.1 | NA |
| Healthy weight | 76 | 57.6 | NA | 85 | 64.9 | NA |
| Underweight (<5%) | 3 | 2.2 | NA | 1 | 0.8 | NA |
| Gross motor skills | ||||||
| Gross motor quotientb | 122 | 93.4 | 9.2 | 122 | 93.5 | 7.9 |
| Stability standard scorec | 131 | 9.9 | 2.2 | 127 | 10.2 | 2.3 |
| Locomotor standard scorec | 131 | 9.2 | 1.8 | 127 | 9.3 | 1.5 |
| Object manipulation standard scorec | 122 | 7.6 | 1.9 | 122 | 7.4 | 1.5 |
| Physical activity | ||||||
| Step counts, 6 days | 83 | 9,708 | 3,058 | 102 | 9,346 | 3,997 |
| Step counts, weekdays | 83 | 9,356d | 2,926 | 102 | 8,974e | 3,481 |
| Step counts, weekend days | 82 | 10,392d | 4,602 | 101 | 10,177e | 6,148 |
Note. BMI = body mass index; CDC = Centers for Disease Control and Prevention; NA = not applicable; SD = standard deviation.
a
No significant differences existed between treatment groups for all categories.
b
Quotient normative score (mean ± SD) = 100 ± 15.
c
Subtest normative score (mean ± SD) = 10 ± 3.
d
Significant differences existed within treatment groups between weekday counts and weekend counts: t(81) = −2.39, p = .02.
e
Significant differences existed within treatment groups between weekday counts and weekend counts: t(101) = −2.61, p = .01.