
Table 2.
Summary of Regression Analysis for Variables Predicting Gross Motor Quotient (GMQ) Difference Score
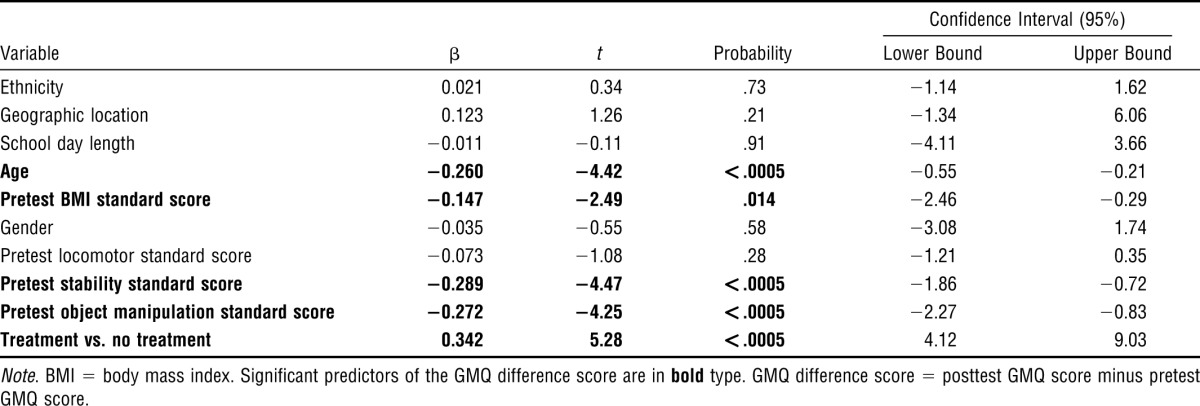
| Confidence Interval (95%) |
|||||
| Variable | β | t | Probability | Lower Bound | Upper Bound |
| Ethnicity | 0.021 | 0.34 | .73 | −1.14 | 1.62 |
| Geographic location | 0.123 | 1.26 | .21 | −1.34 | 6.06 |
| School day length | −0.011 | −0.11 | .91 | −4.11 | 3.66 |
| Age | −0.260 | −4.42 | <.0005 | −0.55 | −0.21 |
| Pretest BMI standard score | −0.147 | −2.49 | .014 | −2.46 | −0.29 |
| Gender | −0.035 | −0.55 | .58 | −3.08 | 1.74 |
| Pretest locomotor standard score | −0.073 | −1.08 | .28 | −1.21 | 0.35 |
| Pretest stability standard score | −0.289 | −4.47 | <.0005 | −1.86 | −0.72 |
| Pretest object manipulation standard score | −0.272 | −4.25 | <.0005 | −2.27 | −0.83 |
| Treatment vs. no treatment | 0.342 | 5.28 | <.0005 | 4.12 | 9.03 |
Note. BMI = body mass index. Significant predictors of the GMQ difference score are in bold type. GMQ difference score = posttest GMQ score minus pretest GMQ score.