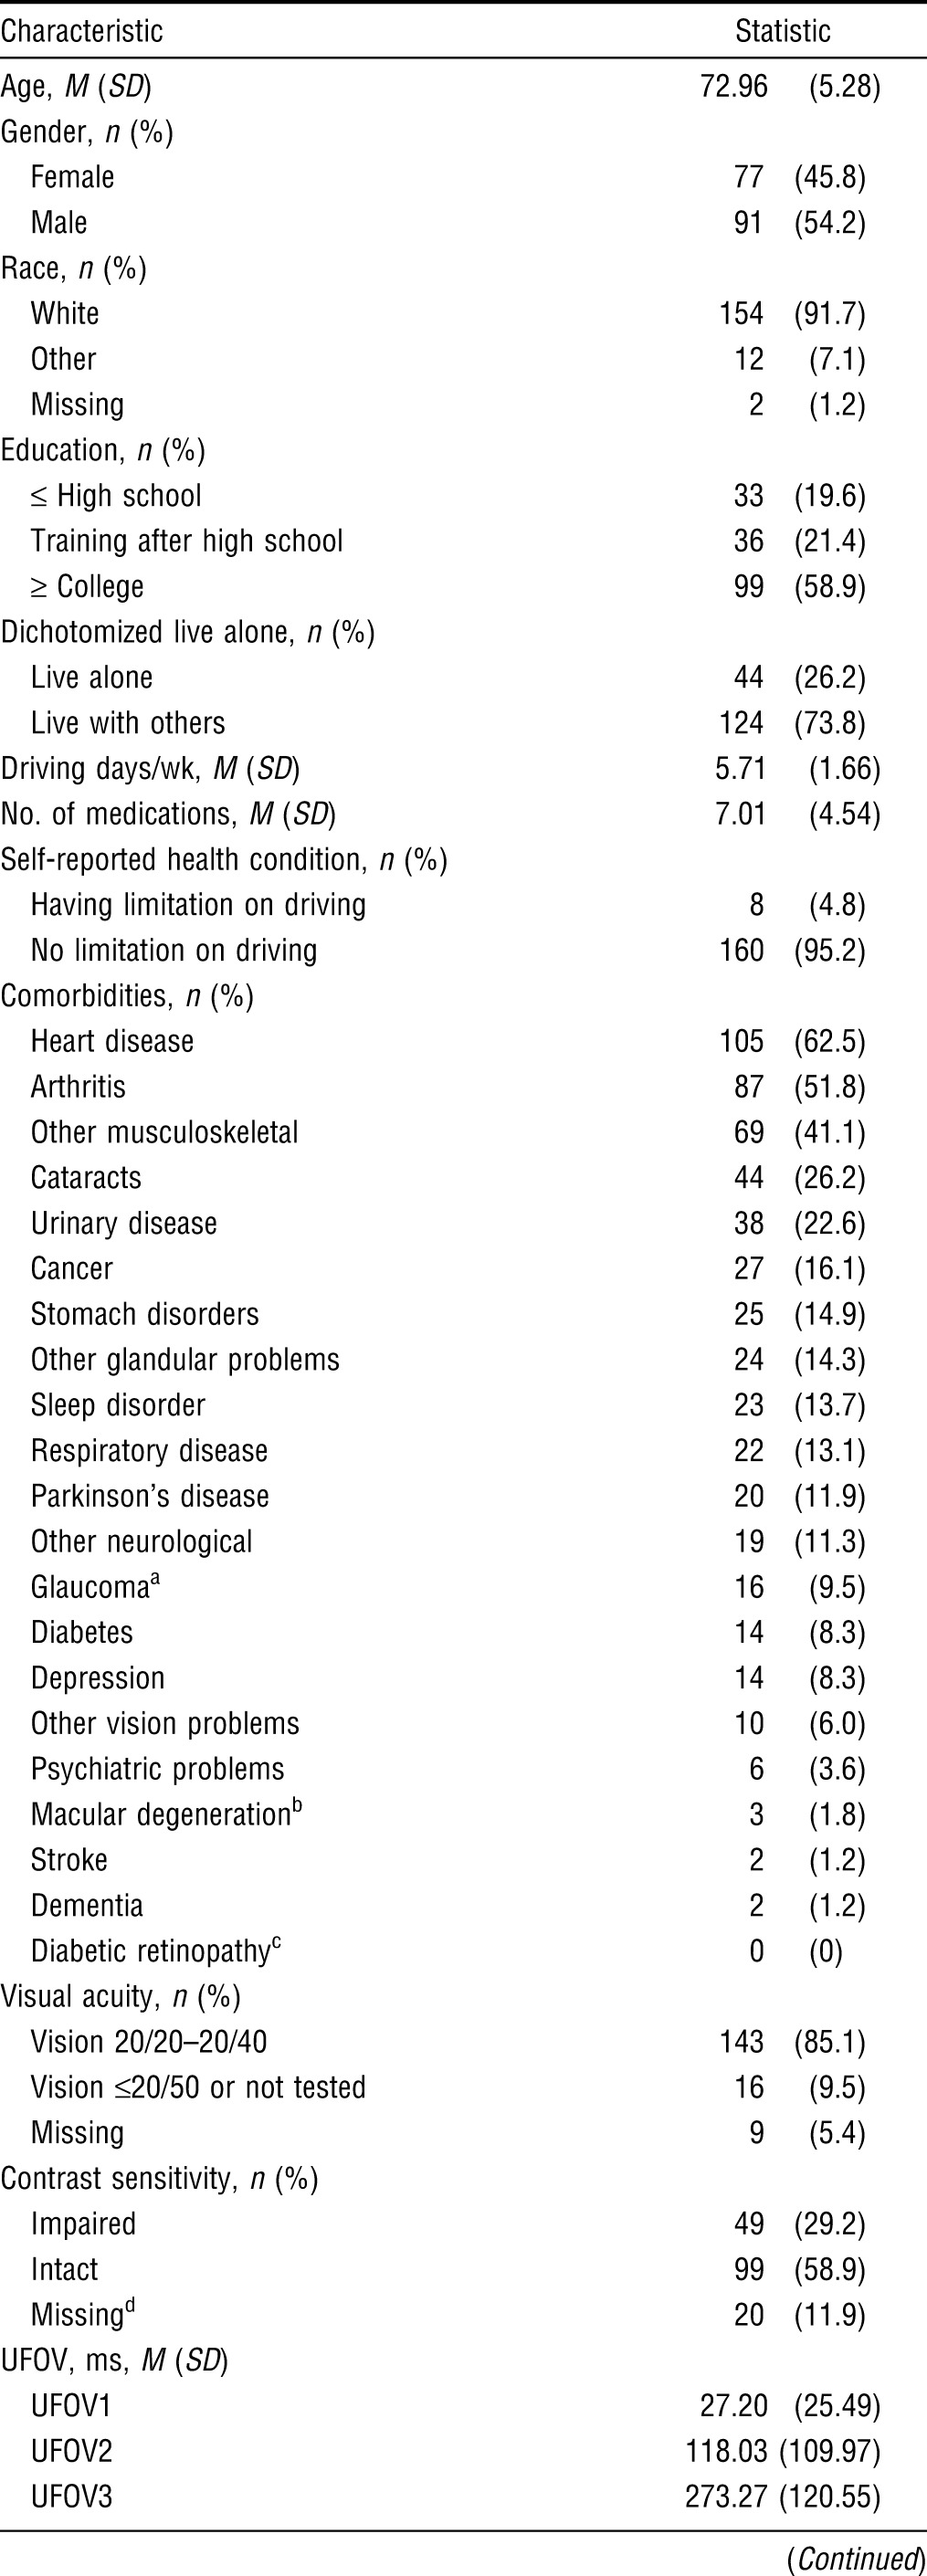
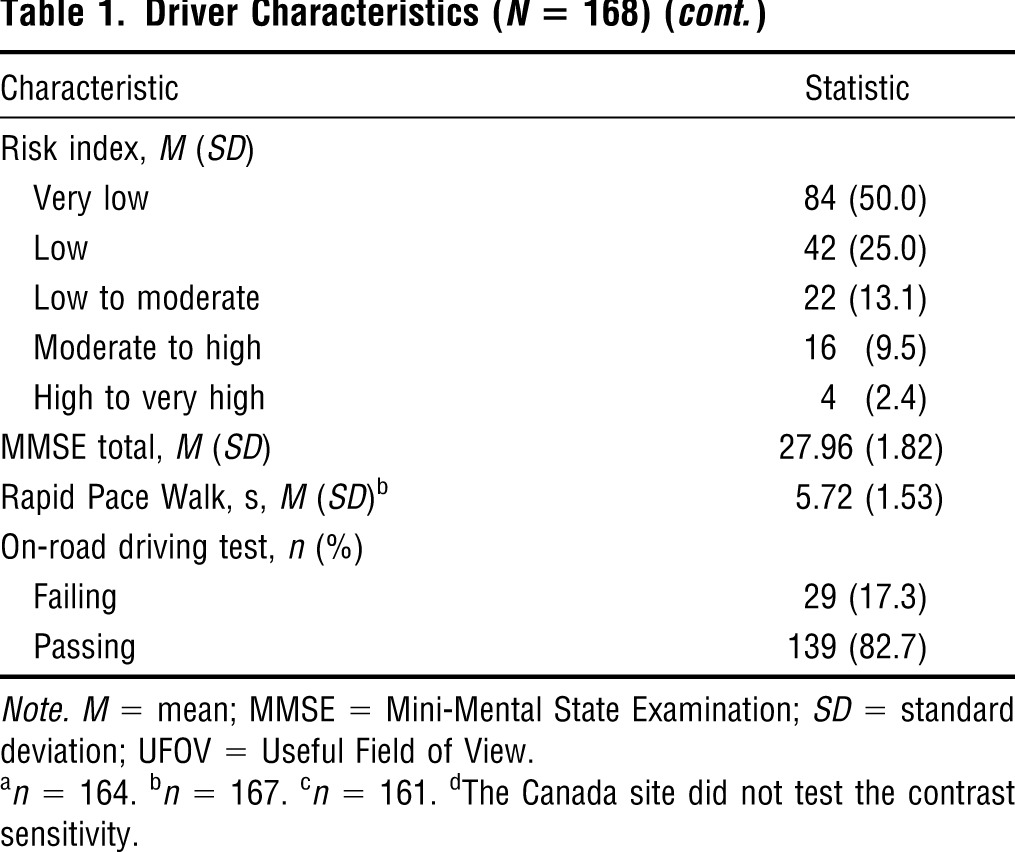
Table 1.
Driver Characteristics (N = 168)


| Characteristic | Statistic |
| Age, M (SD) | 72.96 (5.28) |
| Gender, n (%) | |
| Female | 77 (45.8) |
| Male | 91 (54.2) |
| Race, n (%) | |
| White | 154 (91.7) |
| Other | 12 (7.1) |
| Missing | 2 (1.2) |
| Education, n (%) | |
| ≤ High school | 33 (19.6) |
| Training after high school | 36 (21.4) |
| ≥ College | 99 (58.9) |
| Dichotomized live alone, n (%) | |
| Live alone | 44 (26.2) |
| Live with others | 124 (73.8) |
| Driving days/wk, M (SD) | 5.71 (1.66) |
| No. of medications, M (SD) | 7.01 (4.54) |
| Self-reported health condition, n (%) | |
| Having limitation on driving | 8 (4.8) |
| No limitation on driving | 160 (95.2) |
| Comorbidities, n (%) | |
| Heart disease | 105 (62.5) |
| Arthritis | 87 (51.8) |
| Other musculoskeletal | 69 (41.1) |
| Cataracts | 44 (26.2) |
| Urinary disease | 38 (22.6) |
| Cancer | 27 (16.1) |
| Stomach disorders | 25 (14.9) |
| Other glandular problems | 24 (14.3) |
| Sleep disorder | 23 (13.7) |
| Respiratory disease | 22 (13.1) |
| Parkinson’s disease | 20 (11.9) |
| Other neurological | 19 (11.3) |
| Glaucomaa | 16 (9.5) |
| Diabetes | 14 (8.3) |
| Depression | 14 (8.3) |
| Other vision problems | 10 (6.0) |
| Psychiatric problems | 6 (3.6) |
| Macular degenerationb | 3 (1.8) |
| Stroke | 2 (1.2) |
| Dementia | 2 (1.2) |
| Diabetic retinopathyc | 0 (0) |
| Visual acuity, n (%) | |
| Vision 20/20–20/40 | 143 (85.1) |
| Vision ≤20/50 or not tested | 16 (9.5) |
| Missing | 9 (5.4) |
| Contrast sensitivity, n (%) | |
| Impaired | 49 (29.2) |
| Intact | 99 (58.9) |
| Missingd | 20 (11.9) |
| UFOV, ms, M (SD) | |
| UFOV1 | 27.20 (25.49) |
| UFOV2 | 118.03 (109.97) |
| UFOV3 | 273.27 (120.55) |
| Risk index, M (SD) | |
| Very low | 84 (50.0) |
| Low | 42 (25.0) |
| Low to moderate | 22 (13.1) |
| Moderate to high | 16 (9.5) |
| High to very high | 4 (2.4) |
| MMSE total, M (SD) | 27.96 (1.82) |
| Rapid Pace Walk, s, M (SD)b | 5.72 (1.53) |
| On-road driving test, n (%) | |
| Failing | 29 (17.3) |
| Passing | 139 (82.7) |
Note. M = mean; MMSE = Mini-Mental State Examination; SD = standard deviation; UFOV = Useful Field of View.
n = 164.
n = 167.
n = 161.
The Canada site did not test the contrast sensitivity.
