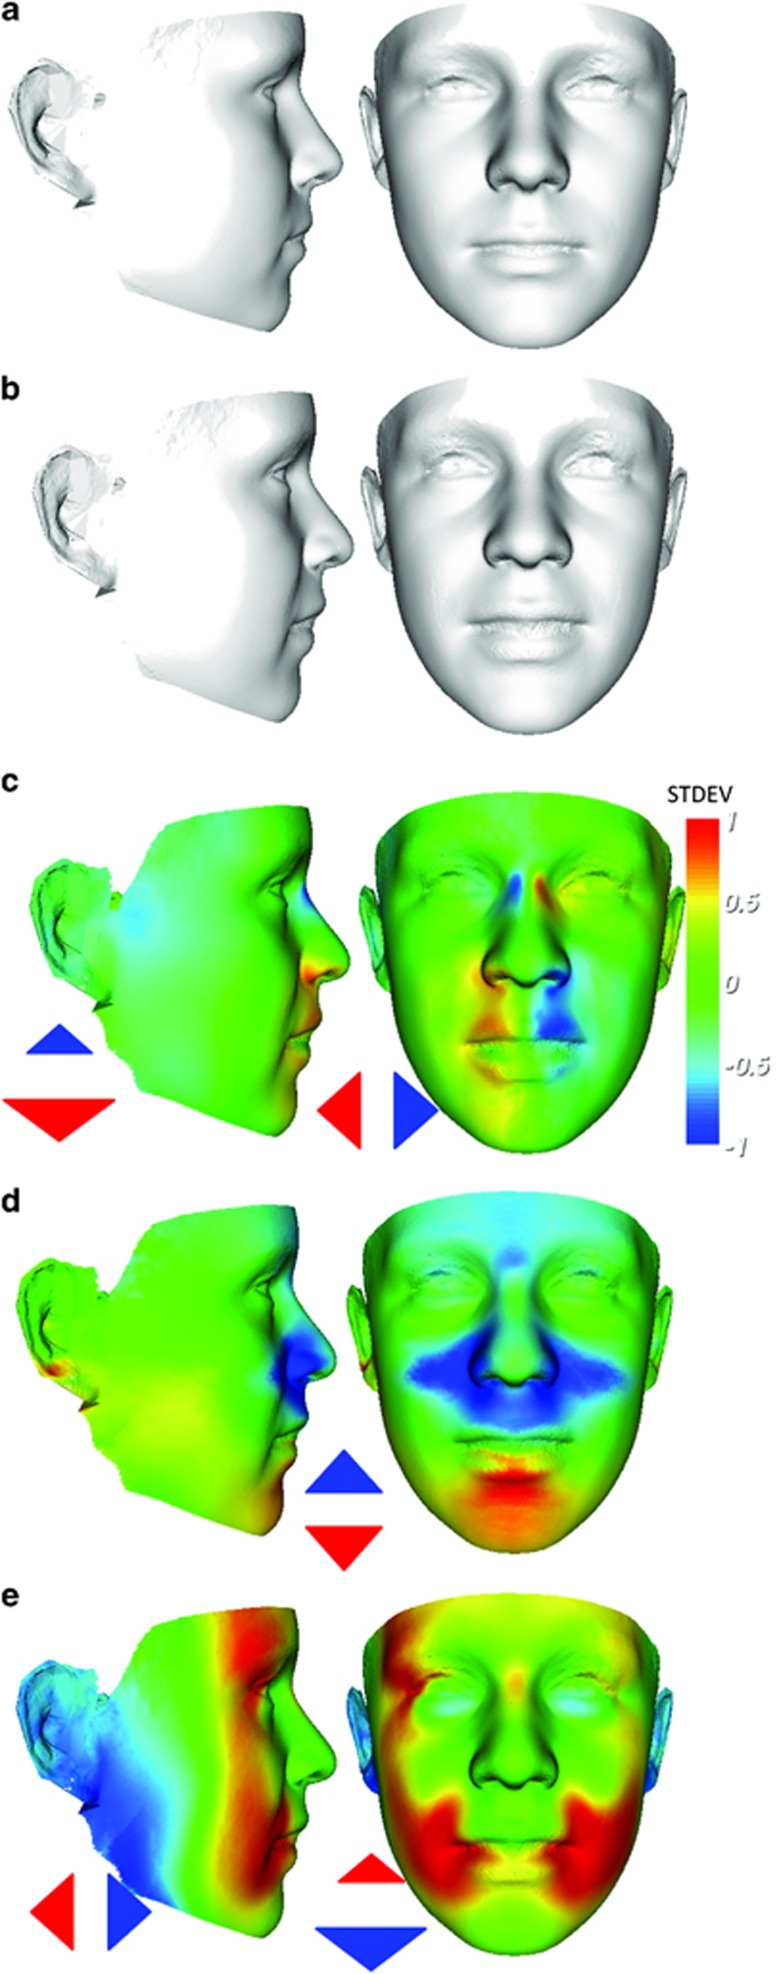
Figure 1.
Average faces of 50 full mutation male individuals with fragile X syndrome (b) and 50 healthy controls (a) with same mean age. Heat maps of position difference with respect to three orthogonal axes for densely corresponded points on surface of average of individuals with a full mutation compared with corresponding position on average of 50-matched male controls. The lateral axis comparison (c) highlights narrow nasal bridge, broader nose and philtrum, narrowness at TMJ and hypotelorism; the vertical comparison (d) reflects upward displacement of the supraorbit and hypotonic droop of the lower jaw; the anterior–posterior comparison (e) shows flattening at the nasal bridge, posterior displacement of the outer canthi and reduced facial depth. The red–green–blue range reflects displacement parallel to the axis concerned with maximal red–blue at 1 SD in opposing directions and green at 0 SD.

