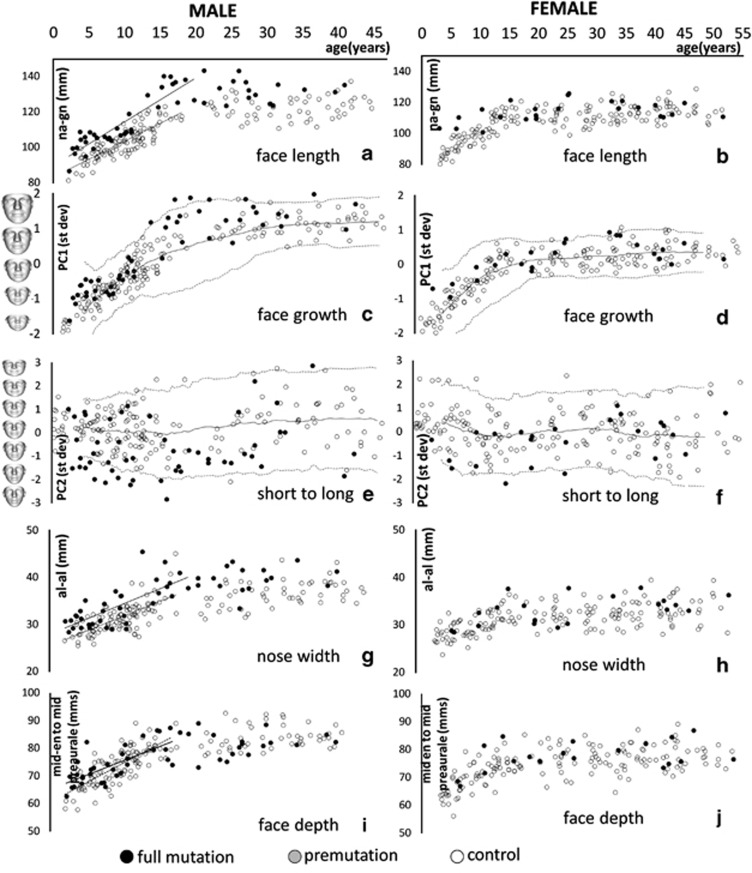
Figure 2.
Male and female scatterplots of age against different face dimensions of individuals with fragile X syndrome and controls. Face length was measured as distance between nasion and gnathion (a–b). Face growth was captured by the principal components analysis mode PC1 (c–d), and long and narrow to short and square-face shape variation was delineated by PC2 (e–f). The ordinate axis is annotated with warps of the mean face of both affected and control individuals at particular values of PC1/PC2. Nose width is distance between nasal alae (g–h). Face depth measured at eye level (mid-en to mid-preaurale) is shown in (i–j).

