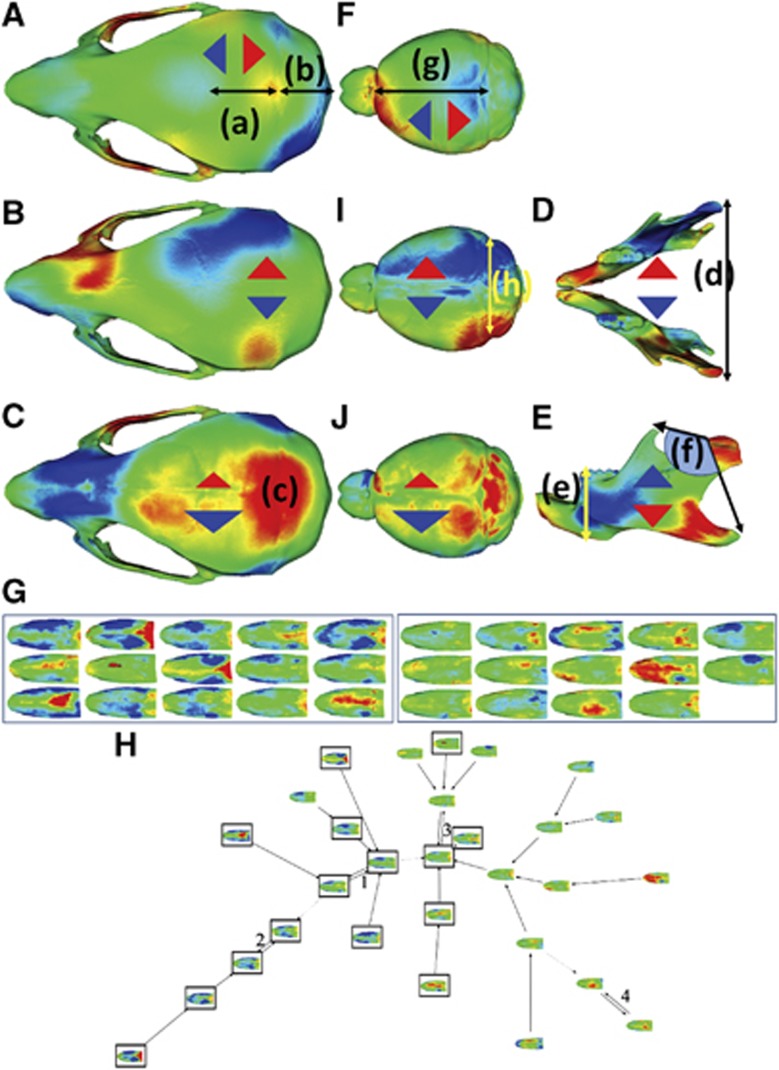
Figure 5.
Shape differences in the mean knockout-mouse skull heat mapped at 1 SD compared with the mean wild-type mouse skull along three orthogonal axes: anterior–posterior (A), lateral (B) and dorsal–ventral (C). Similar comparisons were made for the mandible, vertically (D) and laterally (E), and the inner skull, two axes (F), again heat mapped at 1 SD nasal bone signatures for difference along surface normal for knockout and wild-type mice at 1 SD (G) and associated signature graph showing marked separation in the clustering reflecting the shape difference (H) between WT (frameless) and KO (framed).

