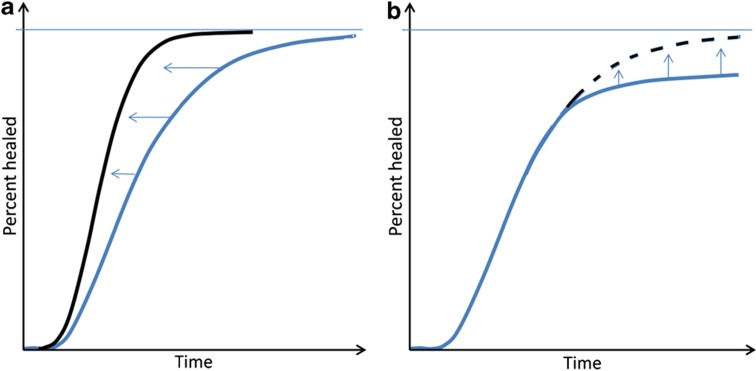
Figure 1. Time to healing for a large number of hypothetical ‘standard' fractures.
A log-normal distribution, or a mixture of log-normal distributions, can be expected, here shown as cumulative log-normal plots. (a) A homogenous fracture population (blue). Note that half of the patients have healed rather quickly, but the curve approaches 100% slowly. A too short time limit for definition of delayed union will, therefore, label normal cases as pathological. If bone formation could be accelerated in all patients, perhaps with PTH, the curve would shift to the left (black). (b) A mixture of two populations (blue): a number of non-healers have been added to the population in a. If the deficient initiation of healing could be prevented, perhaps with a peroperative BMP, the right part of the curve would shift upwards (black).

