
Figure 2.
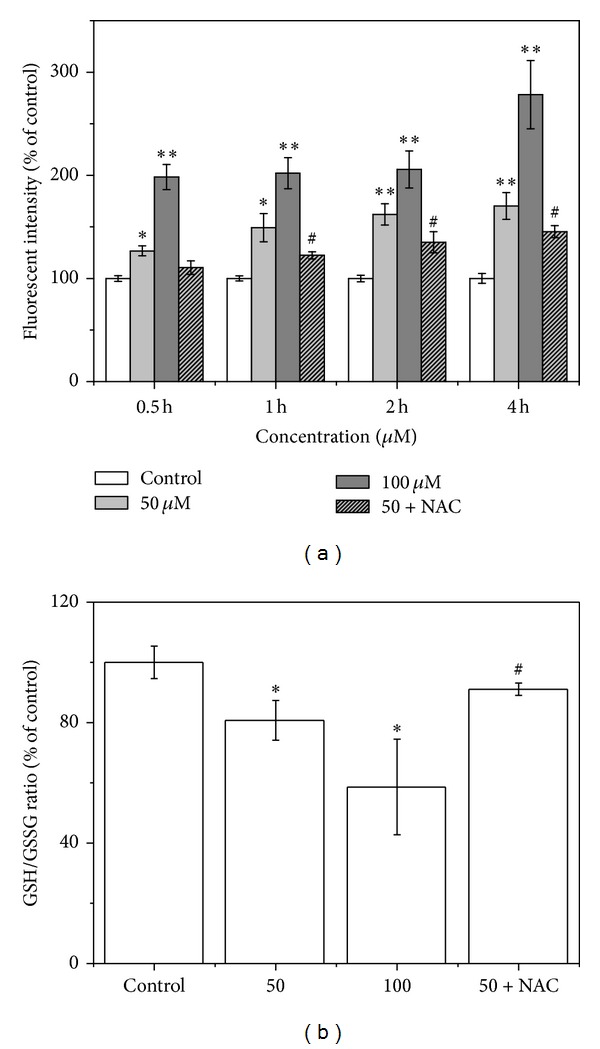
Effects of LCA on ROS level and GSH/GSSG ratio in T24 cells. The cells were treated with LCA (0, 50, or 100 μM) with or without NAC (500 μM). (a) ROS level was determined via flow cytometry. (b) Oxidative stress was measured by GSH/GSSG ratio. Data are presented as the mean ± SD of the three independent experiments. *P < 0.05, **P < 0.01 compared with the control group; # P < 0.05 compared with the LCA group alone (50 μM).