
Figure 6.
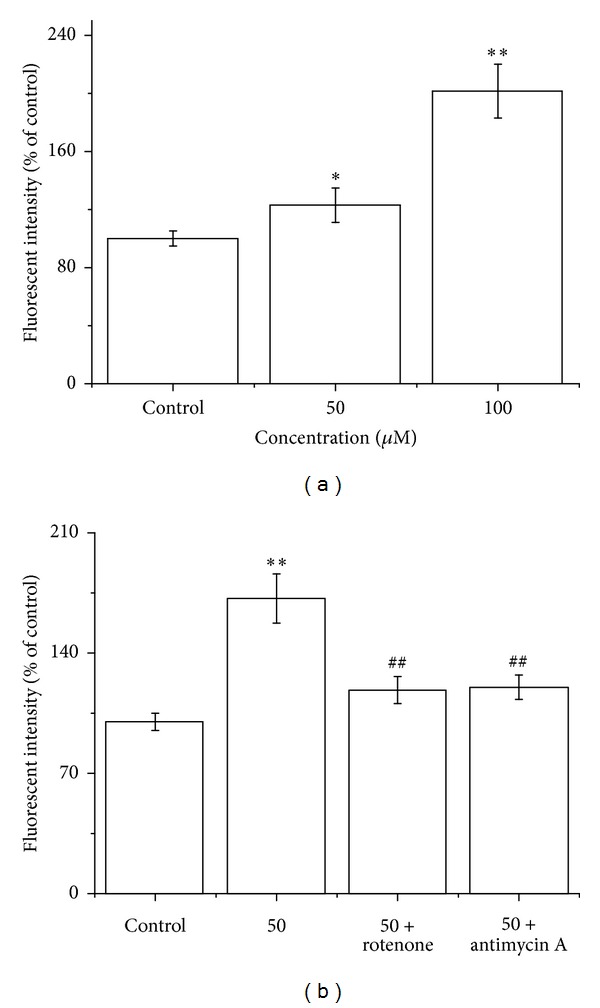
LCA induced mitochondrial ROS generation in T24 cells. (a) The cells were treated with LCA (0, 50, or 100 μM), and then mitochondrial ROS level was measured using DHR. (b) The cells were treated with LCA (0 or 50 μM) with or without mitochondrial complex I inhibitor rotenone (100 μM) or complex III inhibitor antimycin A (20 μM), and then ROS levels were measured using H2DCFDA. Data are presented as the means ± SD of the three independent experiments. *P < 0.05, **P < 0.01 compared with the control group; ## P < 0.01 compared with the LCA group alone (50 μM).