Figure 3.

PBDM decision-making model. This figure shows the PBDM network and the components it models. The bars show the activation strengths of each of the units in the model for a particular point in time.

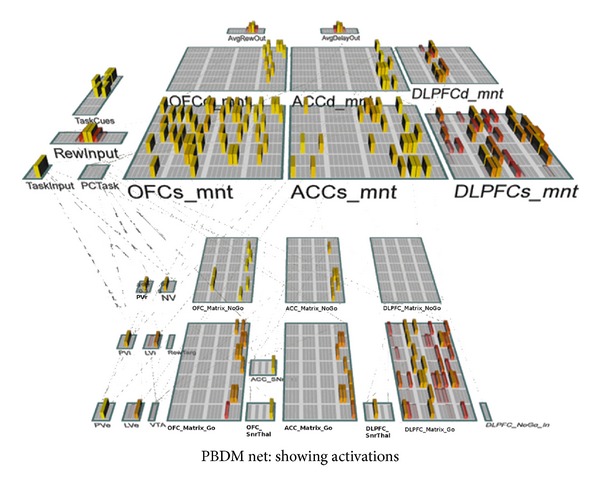
PBDM decision-making model. This figure shows the PBDM network and the components it models. The bars show the activation strengths of each of the units in the model for a particular point in time.