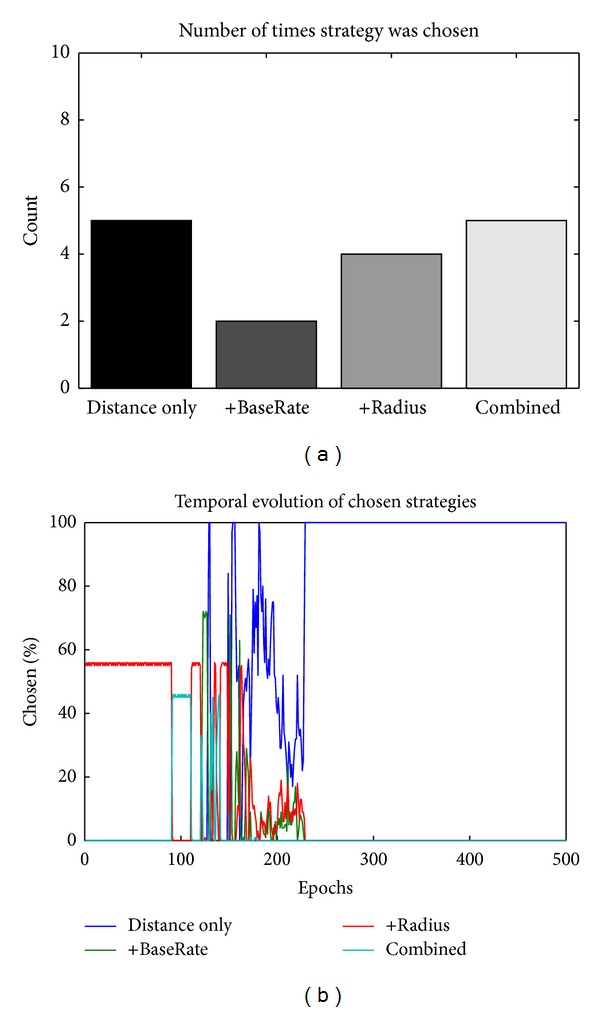
Figure 6.

Balanced reward and delay. The left graph shows the number of times a strategy was chosen over 16 repeats with random initial weights, while the graph on the right shows the temporal evolution of selection for one randomly chosen network. The variability in the equilibrium strategy choice stems from the balance between reward and delay (the higher the reward, the higher the delay) making each strategy approximately equally rational to choose. As discussed in the reward-only case previously, the particular, random history of reward plays a large role in determining the ultimate strategy choice.
