
Figure 4.
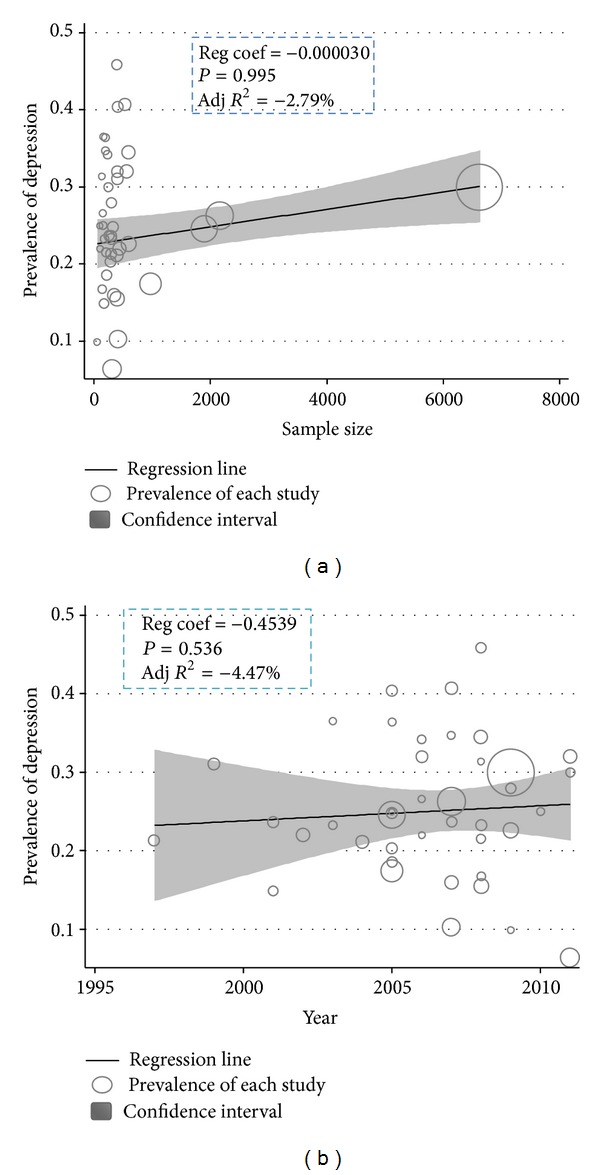
Metaregression plots of change in PPD according to changes in continuous study moderator's year and sample size.
Official websites use .gov
A
.gov website belongs to an official
government organization in the United States.
Secure .gov websites use HTTPS
A lock (
) or https:// means you've safely
connected to the .gov website. Share sensitive
information only on official, secure websites.
Metaregression plots of change in PPD according to changes in continuous study moderator's year and sample size.