Figure 1.

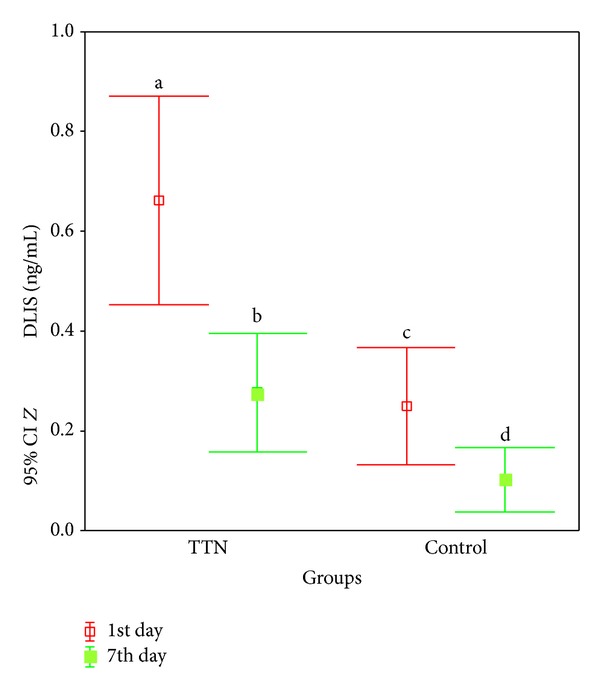
According to the time, DLIS (ng/mL) levels of TTN and control groups for (a versus b) and (a versus c) P < 0.01 and for (c versus d) and (b versus d) P < 0.05.

According to the time, DLIS (ng/mL) levels of TTN and control groups for (a versus b) and (a versus c) P < 0.01 and for (c versus d) and (b versus d) P < 0.05.