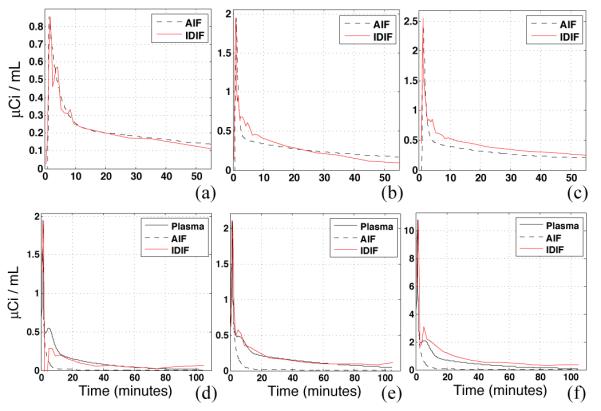
Figure 5.

IDIF results obtained with EPICA applied to FDG (a,b,c) and WAY (d,e,f) data from 6 subjects, using a common brain mask. The common brain mask yielded the lowest average SSE across subjects between IDIF and AIF curves. The FDG brain mask was composed of GM, WM and SV tissues with a range of slices 20-60, bottom 19 slices cutoff. The WAY brain mask was composed of CSF and SV tissues with a range of slices 5-40, top 19 slices cutoff. Under- and over- estimation of the tail is evident with FDG while the peak is under or overestimated with WAY.
