Figure 1.

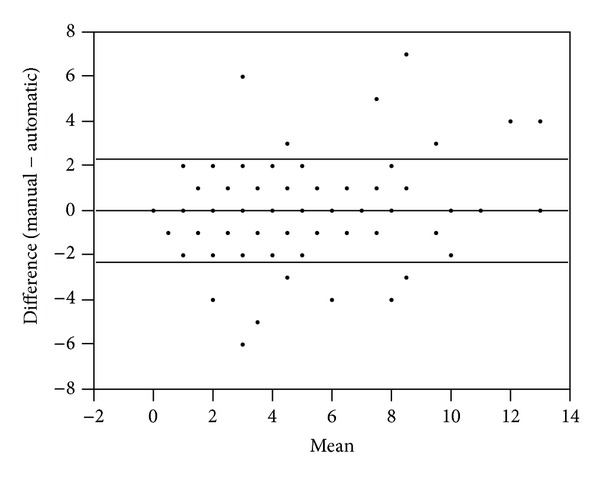
Derivation cohort: Bland-Altman plot of the manual versus automatic scores resulted in a mean difference of 0.02 ± 2.33 (SD, N = 94). Note: plotted values frequently represent more than one patient sample.

Derivation cohort: Bland-Altman plot of the manual versus automatic scores resulted in a mean difference of 0.02 ± 2.33 (SD, N = 94). Note: plotted values frequently represent more than one patient sample.