
Fig. 2.
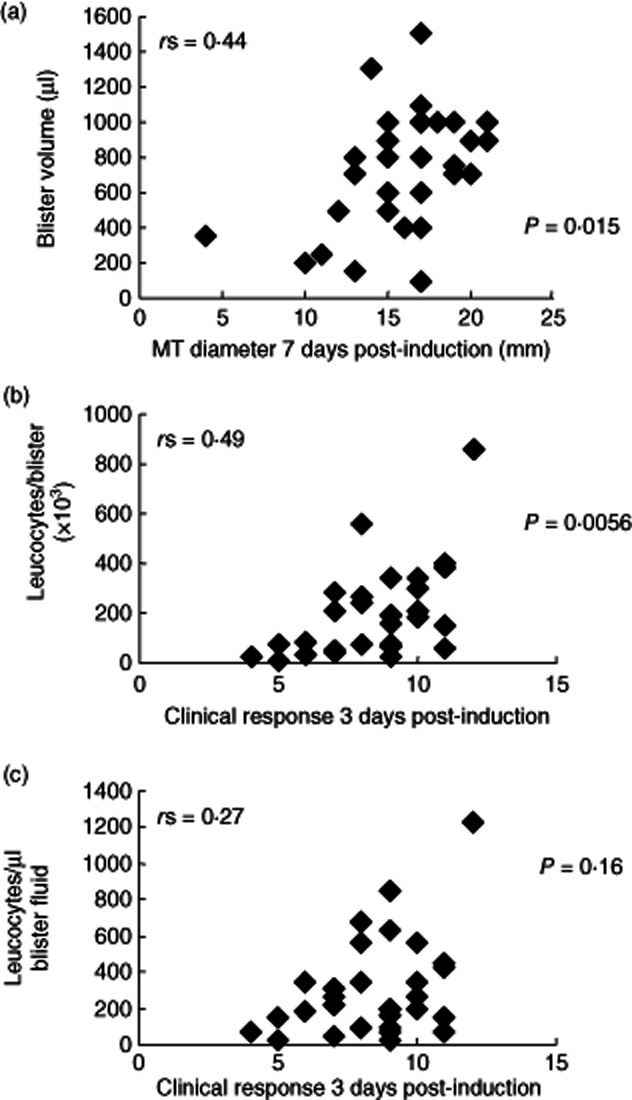
Blister volumes and leucocyte numbers isolated from skin suction blisters raised over Mantoux tests (MT) 7 days after induction. Figures show data collected from 30 skin suction blisters raised on day 7 following MT induction. (a) Blister fluid volume aspirated compared to MT induration diameter (mm) at day 7. (b) Number of leucocytes isolated from skin suction blisters at day 7 compared to the clinical response measured at day 3. (c) Number of leucocytes isolated per microlitre (μl) of skin suction blister fluid at day 7 compared to the clinical response measured at day 3. The Spearman's rank correlation (r) and P-values are shown for each graph.