
Fig. 4.
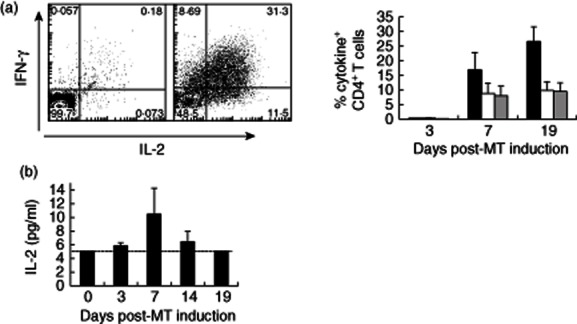
Antigen-specific cells accumulating following Mantoux test (MT) induction make interleukin (IL)-2 and interferon (IFN)-γ. (a) Blister cells were stimulated with purified protein derivative (PPD) ex vivo for 15 h in the presence of brefeldin A. CD4+ T cells were then examined for intracellular IFN-γ and IL-2 expression by flow cytometry. Representative fluorescence activated cell sorter (FACS) plots are shown on the left. The percentage of CD4+ T cells expressing IFN-γ (black bars), IL-2 (white bars) and both IFN-γ and IL-2 (grey bars) are shown. The mean ± standard error of the mean (s.e.m.) of three to four experiments per time-point is shown. (b) IL-2 expression in suction blister (SB) supernatants was assayed by multiplex bead immunoassay using a Luminex 100 and cytokine Beadlyte assay kit. The graph shows the mean ± s.e.m. of three to 18 experiments per time-point. The dotted line on the graph showing IL-2 data denotes the lower limit of detection in the assay.