
Figure 2.
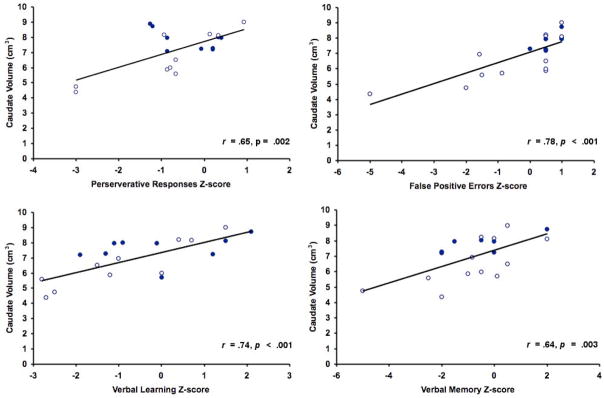
Scatterplots showing relationship between raw caudate volume and neuropsychological test performance, within alcohol-exposed youth (n=19). Neuropsychological test scores were inverted†, if necessary, so that for all neuropsychological variables, higher scores reflect better performance. Open circles depict values of individuals meeting FAS criteria, while closed circles depict values of individuals with histories of prenatal alcohol exposure who did not meet FAS criteria. † The CVLT-C false positives variable was inverted (by multiplying the attained Z-score by -1) so that higher scores indicated better performance. The other variables did not requre inversion, as they were already scaled such that higher scores reflected better performance.