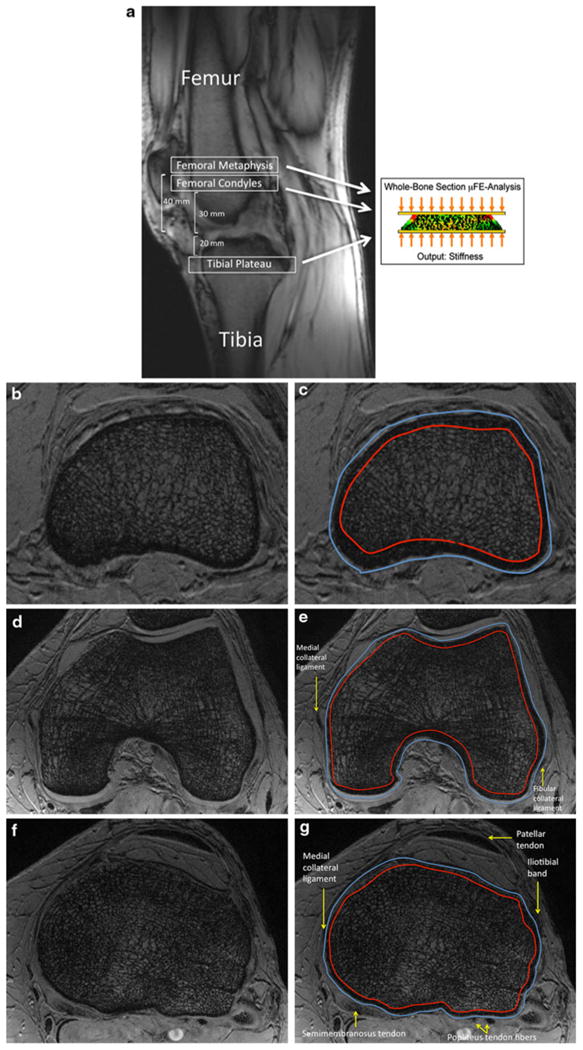
Fig. 1.

a Sagittal MRI localizer image showing the locations of analysis at the distal femoral metaphysis, femoral condyles, and tibial plateau. To compute bone stiffness, μ-FEA was performed using an axial compression simulation. b Representative axial 7T MR image at the level of the distal femoral metaphysis with corresponding segmentation shown in (c). (In MR images of bone, marrow spaces are white and bone is dark.) d Representative axial 7T MR image at the level of the femoral condyles with corresponding segmentation shown in (e). f Representative axial 7T MR image at the level of the tibial plateau with corresponding segmentation shown in (g). The outer segmentation border indicates the periosteal border of bone. The inner segmentation border indicates the endosteal border of bone.
