
Figure 3.
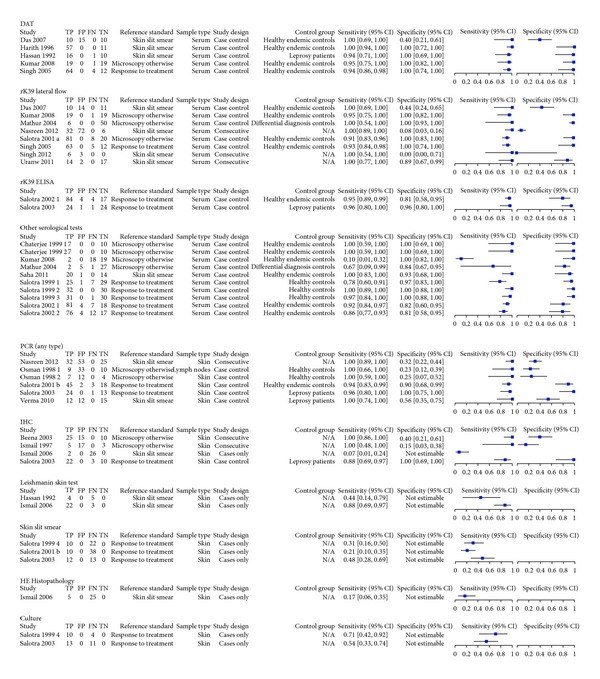
Forest plots of included studies. Overview of all 2 × 2 tables with forest plot (TP = true positives; FP = false positives; FN = false negatives; TN = true negatives; DAT = direct agglutination test; PCR = polymerase chain reaction; IHC = immunohistochemistry). Numbers 1–4 refer to different set of data from the same paper.