
Figure 4.
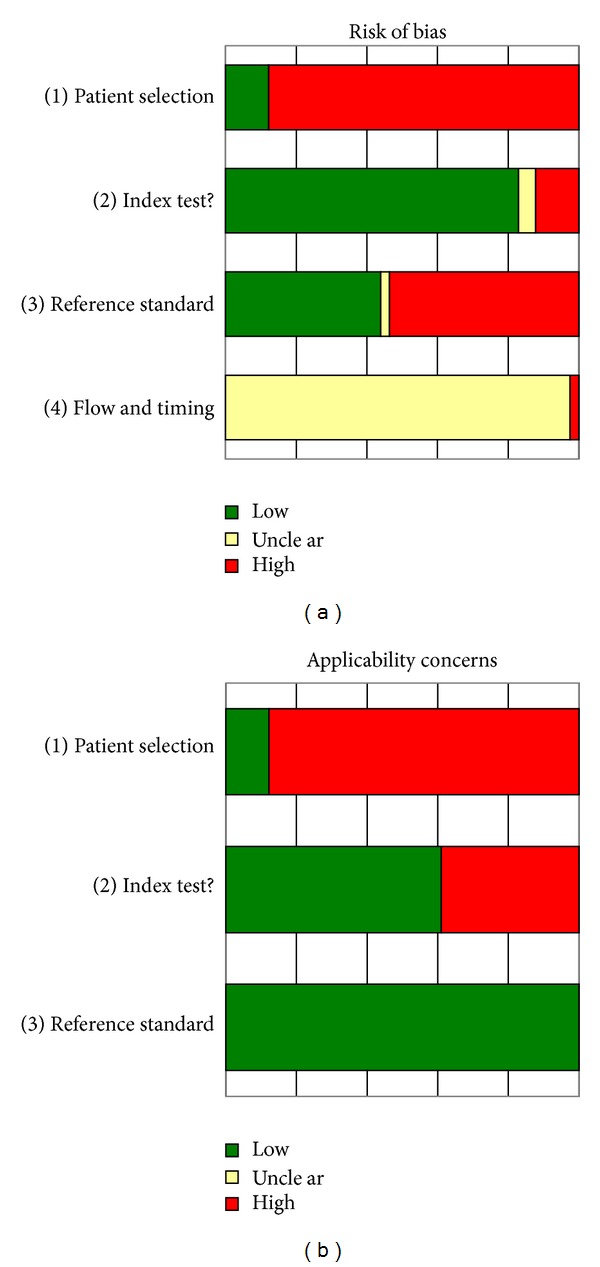
QUADAS-2 results. (a) shows the risk of bias from each of the 41 2 × 2 contingency tables. Note that less than 20% of the included 2 × 2 tables had a low risk of bias for patient selection. (b) shows the risk of applicability of the patients, index, and reference tests to use in PKDL areas.