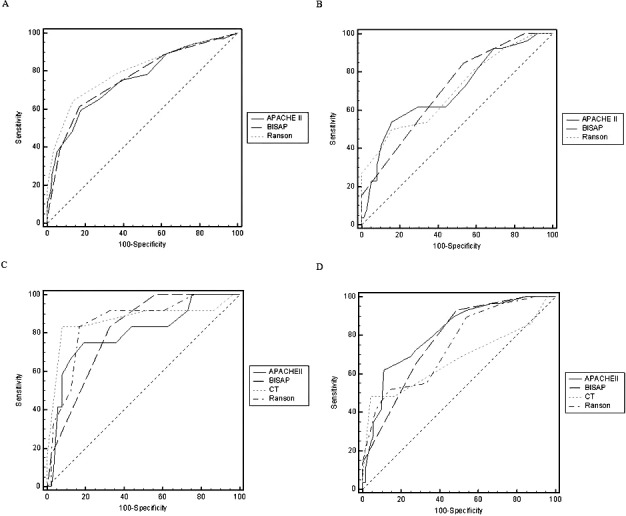
Fig. 1 .

Receiver-operator characteristic curves. Shown are comparison of BISAP, APACHE II, and Ranson scores in predicting SAP (A) and pancreatic necrosis (B), and comparison of BISAP, APACHE II, Ranson, and CTSI scores in predicting mortality (C) and organ failure (D).
