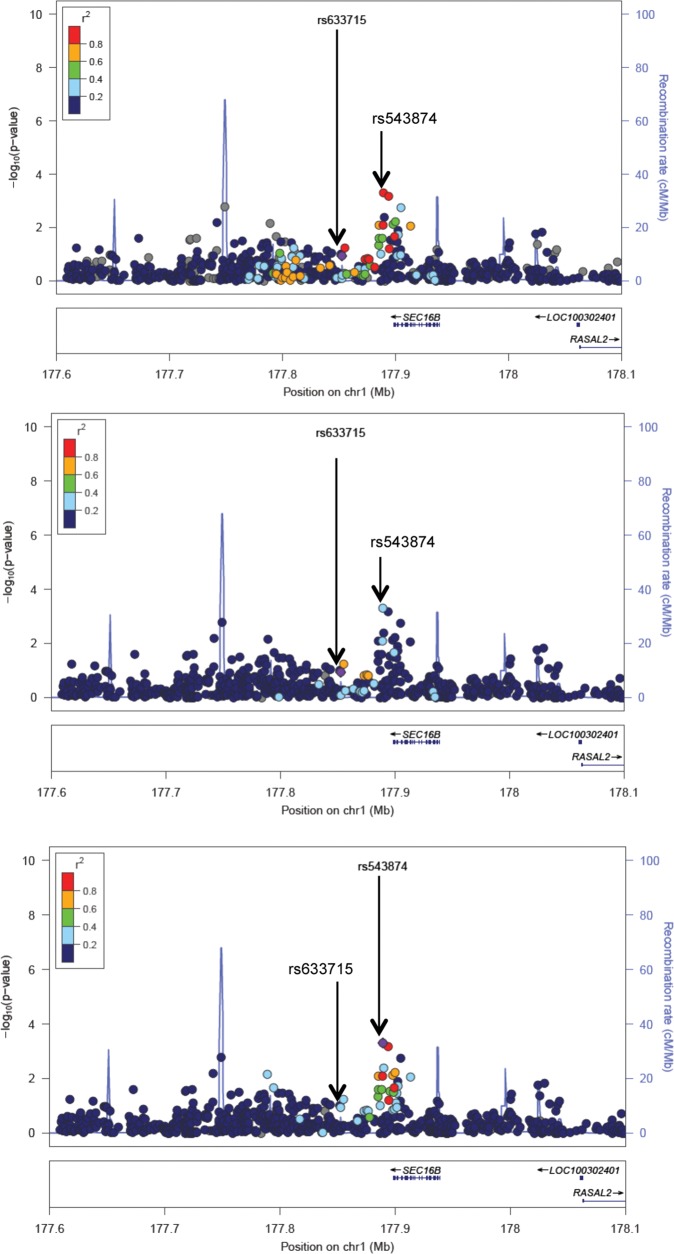
Figure 3.
Fine-mapping of the SEC16B locus in AA women reveals a stronger genetic marker for age at menarche than the index SNP identified in European American women. (A) SNP associations with age at menarche near SEC16B in AAs, using LD from the 1KGP EUR reference panel, in relation to the index SNP rs633715 identified in EA women (purple diamond). The SNP with the lowest P value in the AA meta-analysis (rs543874) is 0.5 Mb upstream from the index SNP and has significantly lower P value (4.9 × 10⁻⁴ versus 0.12). The two SNPs are in strong LD in EUR populations (red color indicates r2 > 0.8), showing that it would be considered the same signal in EA women. (B) SNP associations with age at menarche near SEC16B in AAs, using LD from the 1KGP AFR reference panel, in relation to the index SNP rs633715 identified in EA women (purple diamond). The SNP with the lowest P value in the AA meta-analysis (rs543874) was in relatively weak LD (light blue color indicates r2 between 0.2 and 0.4) with the index SNP in AFR, suggesting they lie on different haplotypes. (C) SNP associations with age at menarche near SEC16B in AAs, using LD from the 1KGP AFR reference panel, in relation to the putatively stronger marker SNP rs543874 (purple diamond). Strong LD in AFR populations between rs543874 and a cluster of SNPs surrounding it, but low LD with SNPs near the index SNP rs633715 is seen. This suggests rs543874 may better localize the causal variant giving rise to the association of menarche age with SNPs near SEC16B previously reported in EA women. Note: SNPs are plotted using Locus Zoom by position on the chromosome against association with age at menarche (−log10 P). Estimated recombination rates are plotted in blue to reflect local LD structure, and the SNPs surrounding the index SNP (or most significant SNP) in each case are color coded to reflect their LD with this SNP, marked as a purple diamond.

