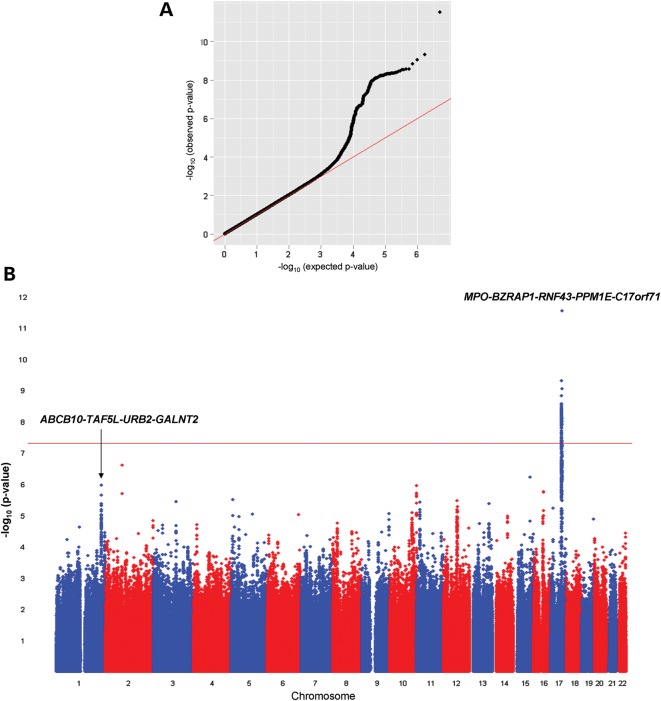
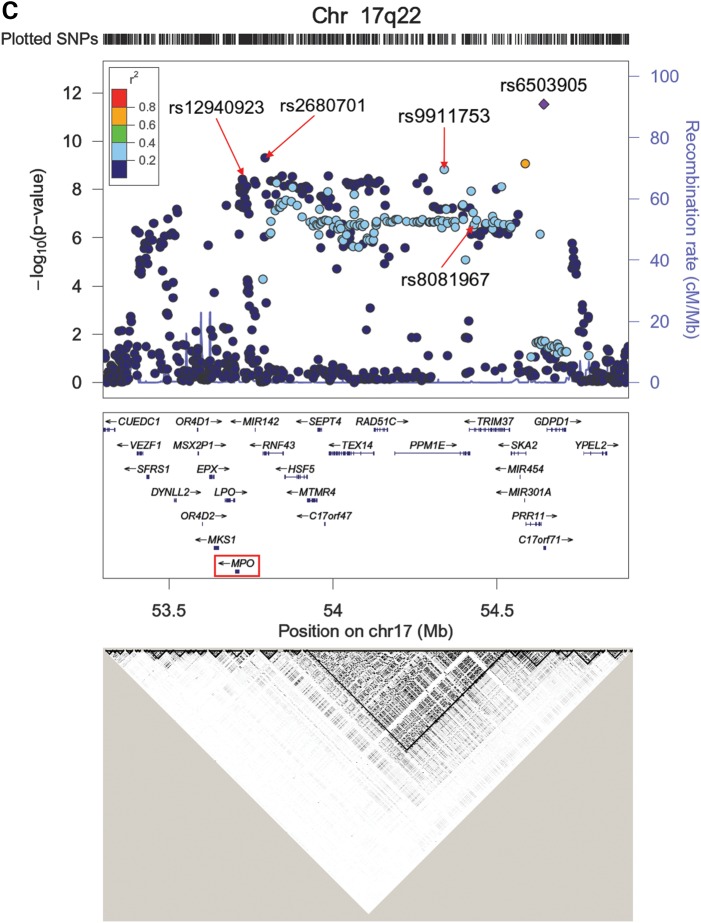
Figure 3.
Results of the GWAS for plasma MPO levels in subjects of European ancestry. The Q–Q (A) and Manhattan (B) plots are shown for the meta-analysis of 9260 subjects from the GeneBank, GHS I, GHS II, LURIC1 and LURIC2 cohorts. (C) Regional plot of a 1 Mb interval on chromosome 17q22 demonstrates several independent SNPs that exceed the genome-wide threshold for significance. The bottom panel shows the LD pattern across this region using CEU data from HAPMAP.


