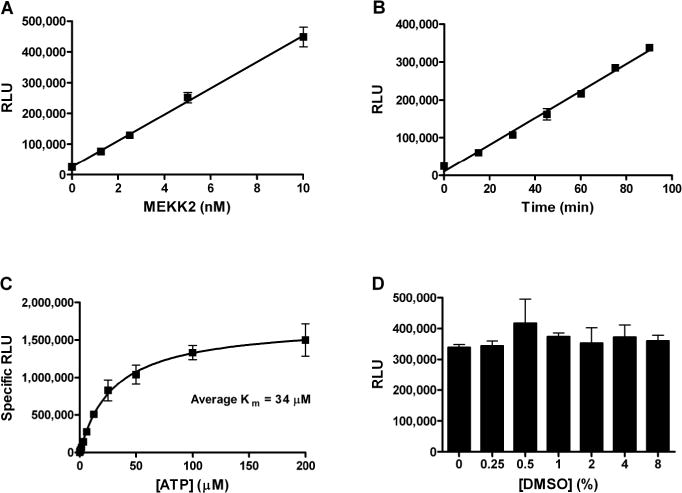
Fig. 1. MEKK2 intrinsic ATPase activity assay characterization.

(A) Assay signal in response to MEKK2 enzyme concentration was assessed. (B) Assay signal linearity with respect to reaction times, as indicated, was determined. (C) The Km for ATP was determined using different concentrations of ATP as indicated, with and without MEKK2. Signal obtained without MEKK2 was taken as assay background for each ATP concentration tested. This value was subtracted from the respective assay signal with MEKK2 to obtain specific RLU values. (D) The assay signal at the indicated concentrations of DMSO was determined. Data points represent the average of three determinations per variable and error bars represent standard deviation. Data are representative of three independent experiments.
