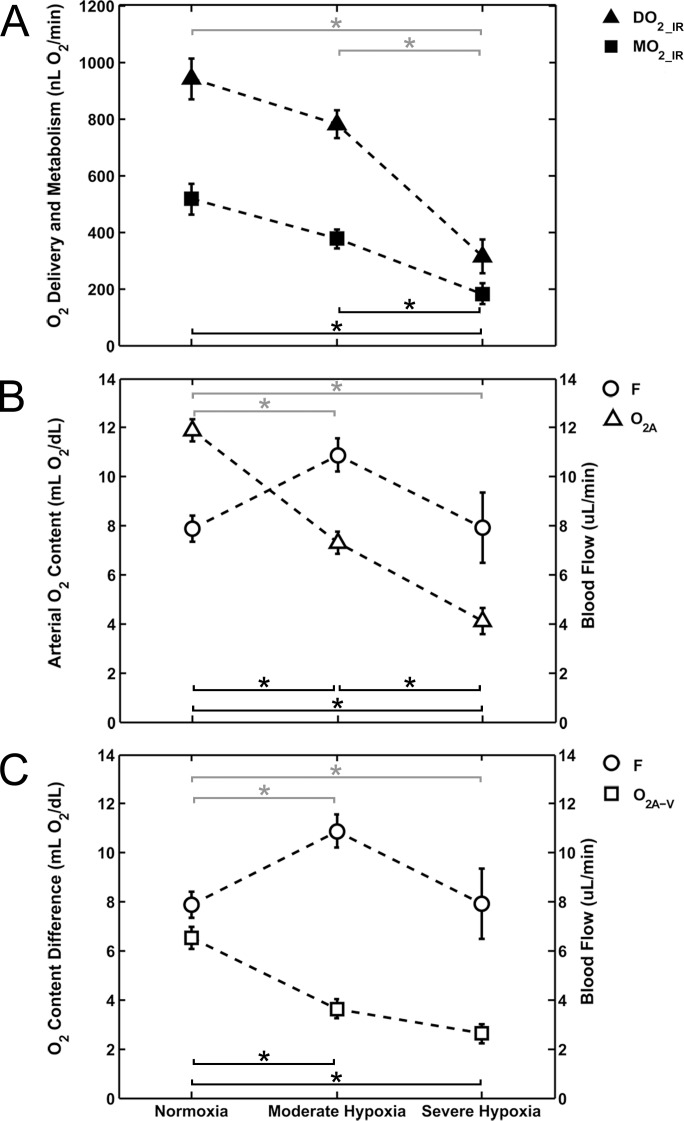
Figure 3.
(A) Mean values of DO2_IR and MO2_IR plotted under normoxia and graded levels of hypoxia. (B) The determinants of DO2_IR: F and O2A. (C) The determinants of MO2_IR: F and O2A−V. Error bars represent the SEM. Black asterisks (MO2_IR, O2A, O2A−V) and gray asterisks (DO2_IR, F) indicate statistically significant pairwise differences (P < 0.05) between FiO2 conditions based on post hoc analysis.

