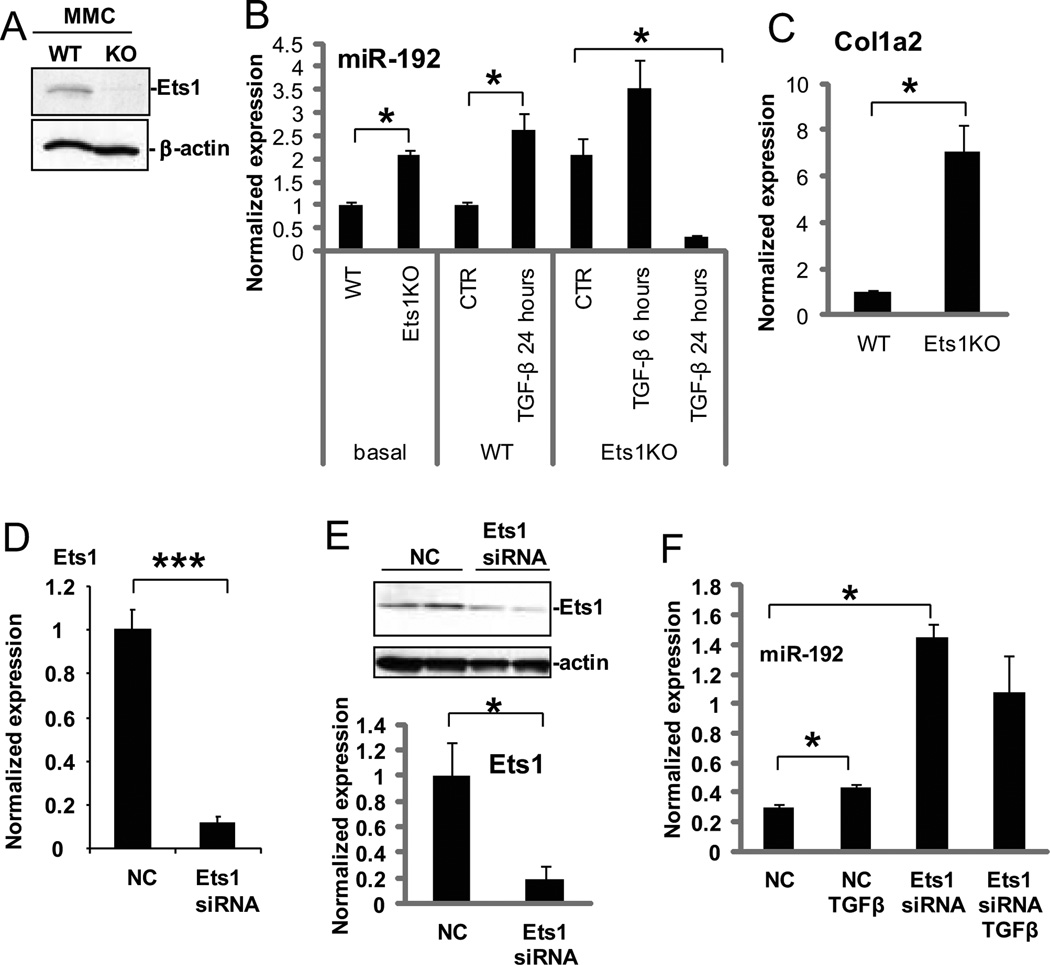
Fig. 2. Expression of miR-192 is increased in Ets-1–deficient MCs and MCs treated with Ets-1 siRNA.
(A) Confirmation of Ets-1 absence in murine MCs from Ets-1–deficient (KO) mice compared with wild-type mice (WT) by Western blotting. (B) Basal or induced (TGF-β or control, CTR) miR-192 expression in Ets-1–deficient MCs compared to wild-type MCs. Data are means ± SEM from 3 experiments. *P < 0.05 by one-way ANOVA followed by Tukey’s post-hoc test analysis. (C) Col1a2 expression in Ets-1-deficient MCs compared twith wild-type MCs. Data are means ± SEM from 3 experiments. *P <0.05 by Student’s t-tests. (D and E) Abundance of Ets-1 mRNA (by PCR, D), and protein (by Western blotting, E) in MCs treated with Ets-1 siRNA compared to MCs treated with negative control oligonucleotides (NC). Data are means ± SEM from 3 experiments.*P <0.05; *** P <0.001 by Student’s t-tests. (F) Basal and TGF-β-induced miR-192 expression in MCs treated with Ets-1 siRNA. Data are means ± SEM from three experiments. *P < 0.05 by one-way ANOVA followed by Tukey’s post-hoc test analysis.

