Figure 5.

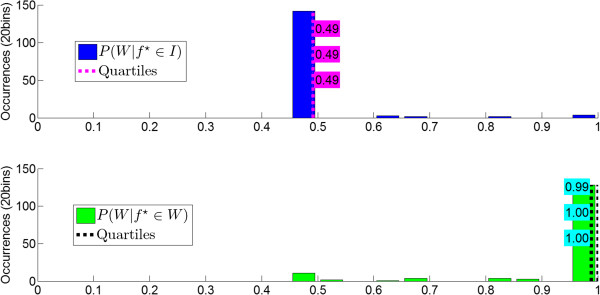
Calibration Histograms. Histograms of the posterior probability of walking KMI given idling, , and walking KMI given walking, , for Participant 3. Note that . Dashed lines indicate the 25%, 50%, and 75% quantiles.

Calibration Histograms. Histograms of the posterior probability of walking KMI given idling, , and walking KMI given walking, , for Participant 3. Note that . Dashed lines indicate the 25%, 50%, and 75% quantiles.