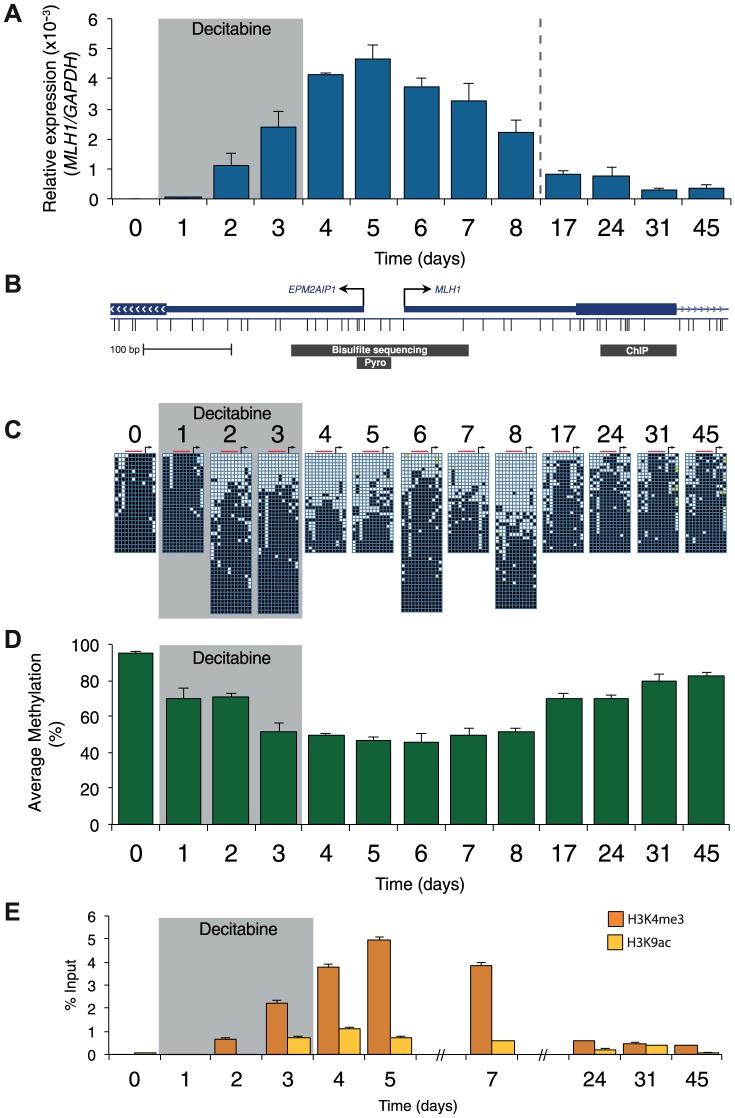
Figure 2. Resilencing precedes promoter remethylation.
A, qRTPCR results showing MLH1 gene expression in RKO cells normalized to GAPDH. B, Schematic of the MLH1 promoter indicating the regions assayed by allelic bisulfite sequencing, bisulfite pyrosequencing (Pyro) and ChIP for 2C, D and E, respectively. C, Allelic bisulfite sequencing across the MLH1 promoter. Black squares = methylated CpG dinucleotides, white squares = unmethylated CpG dinucleotides, yellow filled squares = not determined. Black arrow = MLH1 TSS. Red bar indicates the location of sites assayed using bisulfite pyrosequencing. D, Bisulfite pyrosequencing showing average percentage methylation levels across 5 CpG sites upstream of the MLH1 annotated TSS. E, ChIP qPCR results showing enrichment of H3K4me3 and H3K9ac. Error bars = SD. See also Figure S1.

