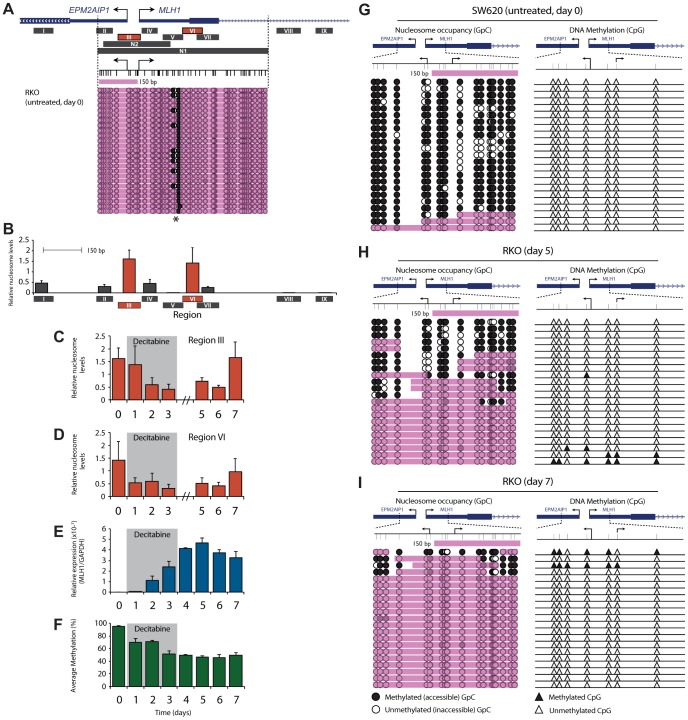
Figure 3. Nucleosome reassembly at the TSS is the initiating event in MLH1 resilencing.
A, Regions assayed for nucleosome occupancy using MNase-qPCR (Regions I–IX) and NOMe-Seq (Regions N1 and N2). Shown beneath the gene schematic is NOMe-Seq data from untreated RKO cells at Region N1. Black arrows indicate the MLH1 and EPM2AIP1 TSS. Bottom panel represents GpC accessibility. Black circles = GpC dinucleotides methylated/accessible to the GpC methyltransferase M.CviPI. White circles = GpC dinucleotides not methylated/inaccessible to GpC methyltransferase. Pink shading indicates regions of inaccessibility of ≥150 bp. Asterix = region of M.CviPI accessibility. B, Relative nucleosome levels in untreated RKO cells at the indicated regions (black bars labeled Regions I–IX) as determined by MNase-qPCR. Drawn to scale with schematic shown in A. Error bars = SD. C and D, qPCR results showing changes in relative nucleosome levels at Regions III and VI following decitabine exposure. E and F, MLH1 gene expression (E) and promoter bisulfite pyrosequencing (F), reproduced from Figure 2A and D for ease of comparison with nucleosome levels. G–I, NOMe-Seq analysis of the MLH1 promoter at Region N2 in SW620 (F) and RKO (G,H) cells at the indicated treatment points. Black filled triangles = methylated CpG dinucleotides; white filled triangles = unmethylated CpG dinucleotides. See also Figure S2.

