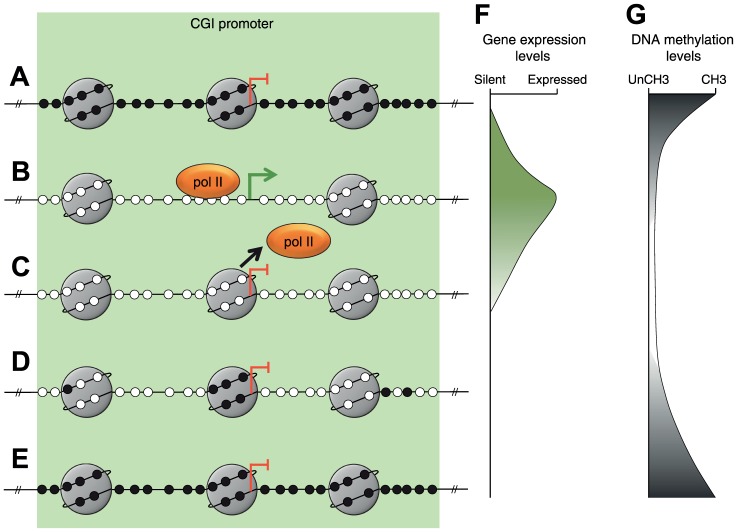
Figure 4. A model of MLH1 resilencing.
A–E, Depiction of the sequence of epigenetic changes at the MLH1 promoter associated with resilencing. Small black filled circles represent methylated CpG dinucleotides. Small white filled circles represent unmethylated CpG dinucleotides. Large gray circles represent nucleosomes. Orange oval represents the RNApolII complex. The green arrow and blunt red arrows indicate the MLH1 transcription start site and expression status. F, G, Representation of gene expression and DNA methylation levels associated with each of the stages depicted in A–E, respectively.

