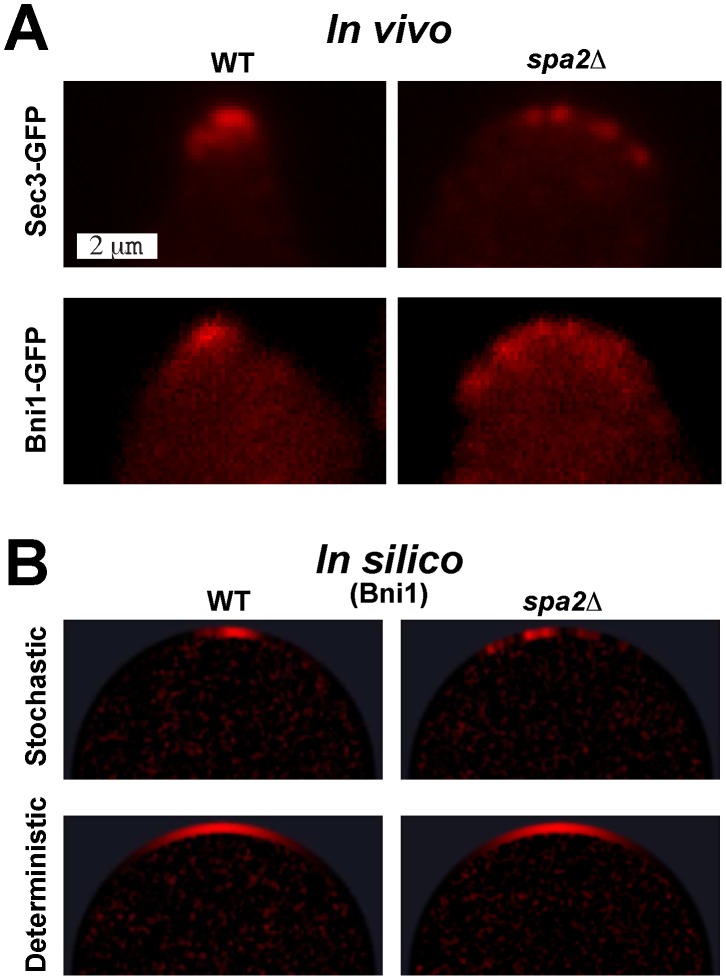
Figure 7. The multi-polarisome phenotype in  cells.
Columns: WT phenotype (left),  phenotype (right). (A) In vivo microscopy images of polarizing yeast cells marked with Sec3-GFP (top row) and Bni1-GFP (bottom row). Note the difference between the single punctuate polarisome (left) and the multi-polarisome phenotype (right). Also see video S5. (B) In silico snapshots of yeast polarisome simulations for both stochastic (top row) and deterministic (bottom row) models showing Bni1. Note that only the stochastic in silico model is able to match the in vivo multi-polarisome phenotype. Also see video S6.

