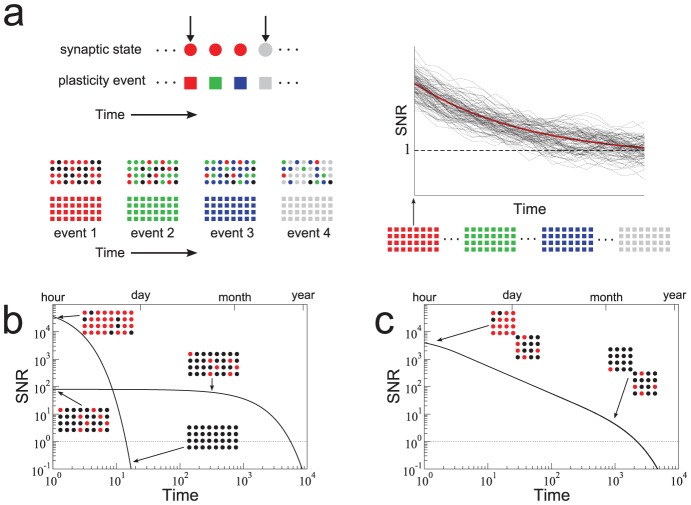
Figure 1. Heterogeneity in synaptic learning rates is desirable.
a. Upper left: Each synapse is updated stochastically in response to a plasticity event, and encodes one bit of information of one specific memory because it has only two states. For this reason, we can assign a color to each synapse which represents the memory that is stored. Lower left: Memories are encoded by subjecting  synapses to a pattern of plasticity events, here illustrated by different colors. These patterns, and hence the memories, are random and uncorrelated. The strength of a memory is defined as the correlation between the pattern of synaptic weights and the event being tracked. The degradation of encoded memories is due to the learning of new memories. Only four memories are explicitly tracked in this example: red, green, blue, gray. Those synapses whose state is correlated with previous memories are colored black. Right: Synaptic updating is stochastic in the model leading to variability in the signal for different realizations given the same sequence of events (dotted lines). A mean-field description of the stochastic dynamics captures signal strength averaged over many realizations. We measure the signal-to-noise ratio (SNR) which is the signal relative to fluctuations in the overlap of uncorrelated memories. b. There is a trade-off between the initial SNR and the memory lifetime: A large initial SNR can be achieved if the probability
  of a synapse changing state is high (
 ), although the decay is rapid, i.e. the memory lifetime scales as
  , where
  is the total number of synapses. Long lifetimes can be achieved for small
  although the initial SNR is weak. Memory lifetime can be as large as
  , when
  . SNR vs time curves are shown for
  and
and  and
and  . c. In a heterogeneous population of synapses in which many qs are present, one can partially overcome the trade-off (black line). The initial SNR scales as
  , where
  is the learning rate corresponding to the slowest population. The memory lifetime scales as
  . Here there are 50 different qs,
  where
where  and
and  synapses of each type.
  .
.

