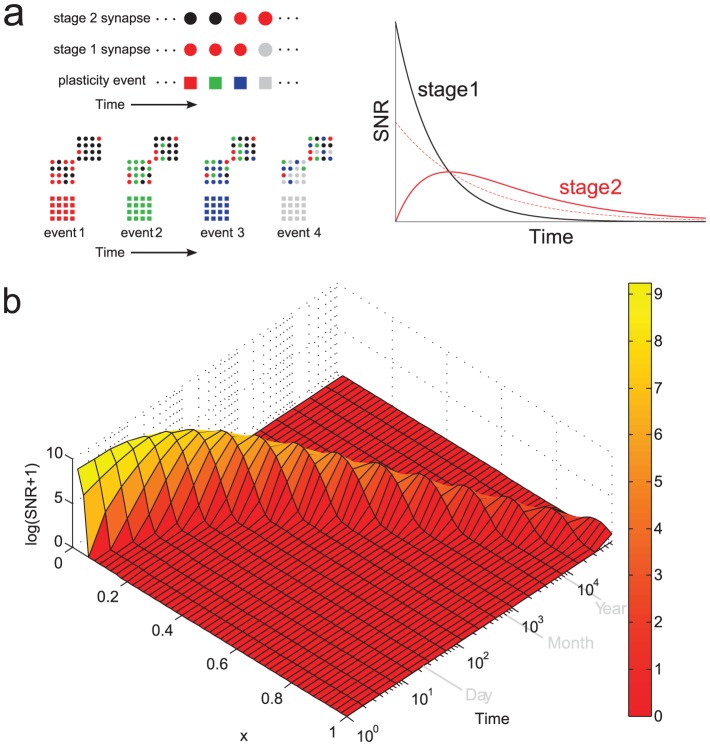
Figure 2. The memory transfer model.
a. Upper left: In the model, the state of each synapse in stage one is updated stochastically in response to the occurrence of plasticity events. The synapses of downstream stages update their state according to the state of upstream stages. Lower left: Memories are encoded by subjecting the  synapses in stage 1 of
  stages to a pattern of plasticity events, here illustrated by different colors. The correlation of synaptic states with a memory is initially zero in downstream stages, and builds up over time through feed-forward interactions. Right: The consolidation model always outperforms the heterogeneous model without interactions at sufficiently long times. Here a two-stage model is illustrated. The dashed line is the SNR of the second stage in the heterogeneous model. See text for details. b. The memory wave: the memory trace (from Eq. 1) in the consolidation model travels as a localized pulse from stage to stage (starting from
  , in fast learning stages, presumably localized in the medial temporal lobe, and ending at
  , in slow learning stages). Here
  and
and  . Stage
  has a learning rate
  and
and  . New memories are encoded at a rate of one per hour.

