
Figure 4. Molecular signatures from multi-study, integrated datasets have higher average phenotype prediction accuracy and lower performance variance than those from individual datasets.
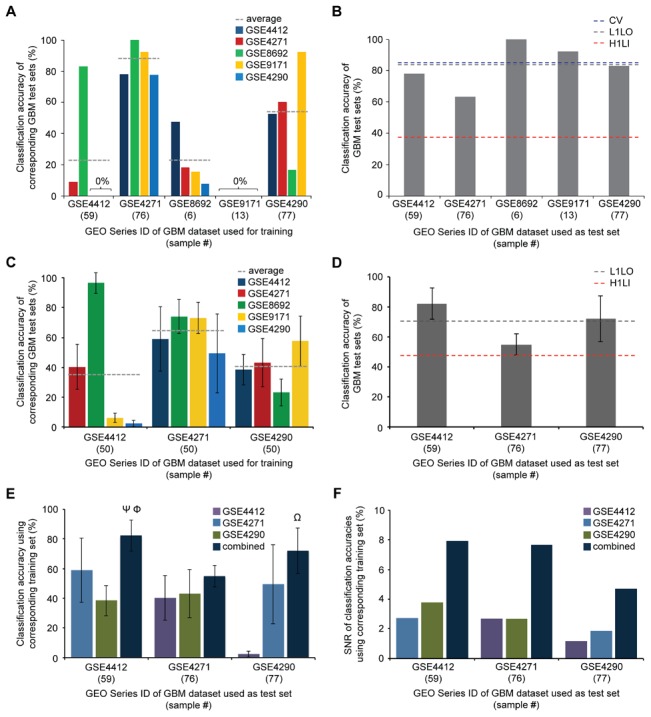
A Hold-one-lab-in validation results for each of the five glioblastoma (GBM) datasets. Gray line indicates average accuracy on the four validation sets. B Leave-one-lab-out validation results for each of the five GBM datasets. Blue and red line indicates average accuracy of GBM signatures from leave-one-lab-out (L1LO) validation and hold-one-lab-in (H1LI) validation, respectively. C H1L1 validation to test GBM signatures from GSE4412, GSE4271, and GSE4290, while keeping the number of samples in the GBM training set the same. 50 samples were randomly selected from each GBM dataset for signature learning. H1LI validation was executed ten times for each of the three GBM datasets. Error bars indicate standard deviations. D L1LO validation to test GBM signatures on GSE4412, GSE4271, and GSE4290 validation sets, while 50 total samples were randomly selected from the other four GBM datasets for signature learning. L1LO validation was executed ten times. E Data from C and D are used to show GBM signatures' accuracies on GSE4412, GSE4271, and GSE4290 validation sets when the GBM training data were from individual or combined GBM datasets. Ψ, Φ, and Ω indicate statistical significance relative to GSE4271, GSE4290, and GSE4412, respectively (Tukey's post-hoc test, p<0.01). F Signal-to-noise ratios (SNRs) from data in E. SNR was calculated as the ratio of average accuracy to standard deviation.