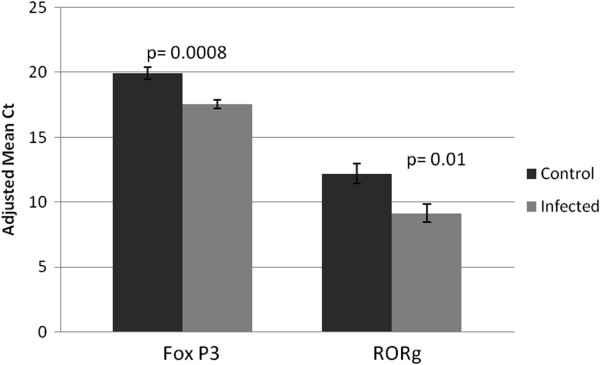
Figure 1.

Expression of FoxP3 and RORγ in control and infected early term placental tissue. Real time pPCR was used to quantify the expression of FoxP3 and RORγ RNA in control (n = 10) and infected (n = 8) early term whole placental tissues. Adjusted mean Ct, represented by vertical bars, is the normalized mean Ct value subtracted from a negative endpoint (50-mean Ct). Bars are bracketed by the standard error of the mean. The data were analyzed using single factor ANOVA. P values ≤ 0.05 were considered significant.
