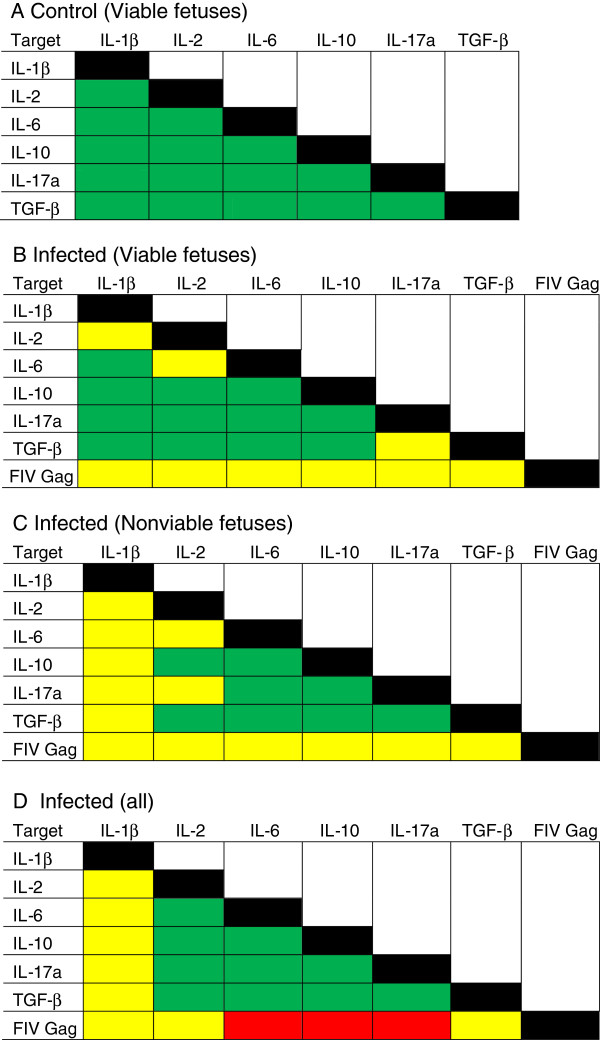
Figure 3.
Summary of pairwise comparisons of cytokine gene expression and FIV gag expression in early term placental tissue from viable and nonviable offspring from control and infected queens. The expression of each gene was compared to that of all other genes. (A) control queens producing viable offspring (control viable; n = 16); (B) infected queens producing viable offspring (infected viable; n = 9); (C) infected queens producing nonviable offspring (infected nonviable; n = 6); (D) all infected samples combined (all infected; n = 15). Pairwise comparisons were analyzed using Spearman rank correlation regression analysis. P values ≤ 0.05 were considered significant. Green = positive correlation; yellow = no correlation; and red = negative correlation.

