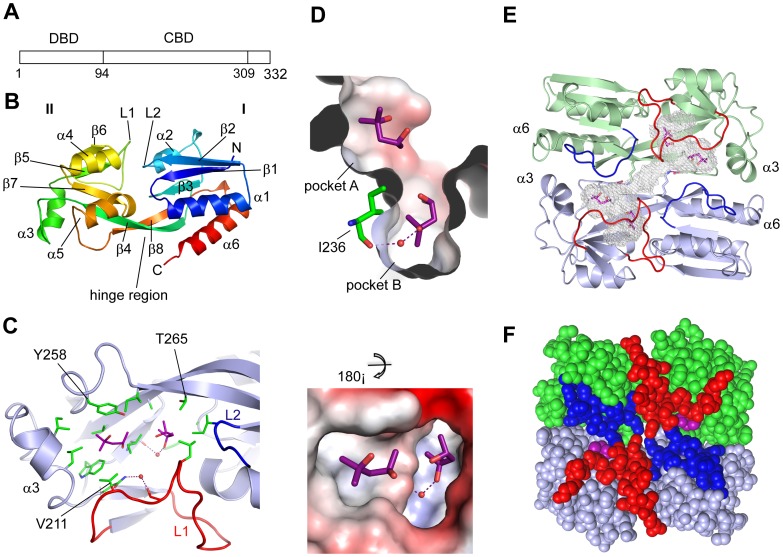
Figure 3. Crystal Structure of the PqsRCBD.
(A) Diagrammatic representation of the linear PqsR protein showing the positions of the DNA-binding (DBD) and co-inducer-binding (CBD) domains; (B) Topology diagram of the PqsRCBD monomer consisting of two sub-domains and a hinge region; (C) PqsRCBD hydrophobic ligand-binding pocket with two bound MPD molecules shown as purple sticks; (D) Charged surface representation of the A and B pockets shown as two views related by a 180° rotation. Hydrogen bonds are shown as dotted lines and water molecules as red spheres; (E) The PqsRCBD dimer shown as a topology diagram with bound MPD molecules shown as sticks. Loops forming a lid are coloured red and blue. The Lys266 and Glu259 residues are shown as sticks with the salt bridge shown as a purple dotted line. The pocket shape is shown as a white mesh. (F) The PqsRCBD dimer shown as solid spheres with the same colour scheme.

