Figure 2.

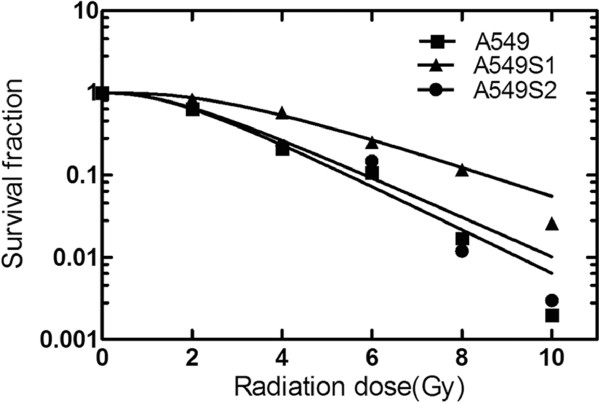
Survival curves of A549, A549S1 and A549S2 cells after three months of culture. Cell survival curves were obtained using the single-hit multi-target model (S = l-(1-e-D0/D)N) and the parameters of SF2, D0, Dq and N were calculated.

Survival curves of A549, A549S1 and A549S2 cells after three months of culture. Cell survival curves were obtained using the single-hit multi-target model (S = l-(1-e-D0/D)N) and the parameters of SF2, D0, Dq and N were calculated.