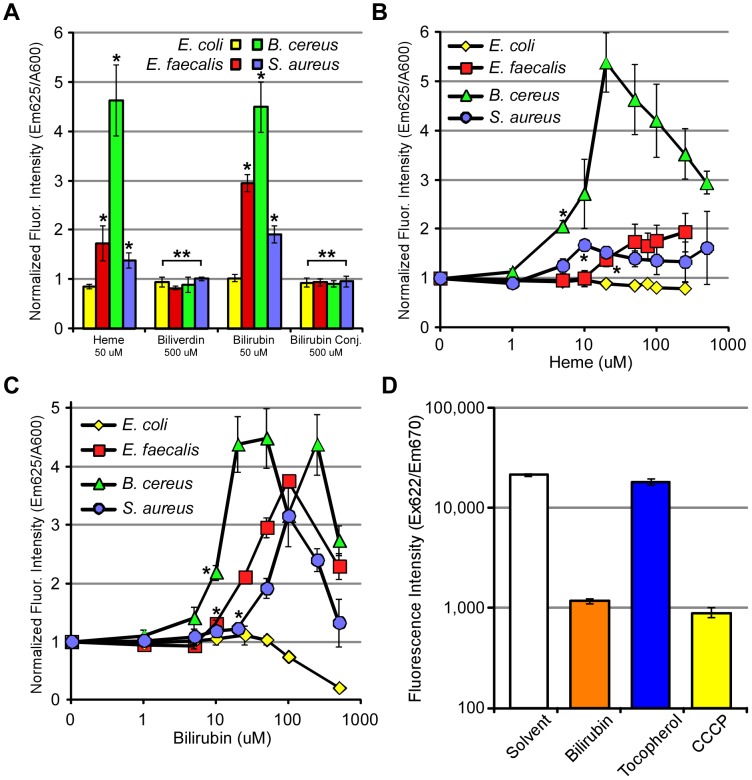
Figure 5. Membrane disruption by bilirubin.
(A) Bacteria including EHEC (86-24), E. faecalis, S. aureus, and B. cereus were incubated with heme, biliverdin, bilirubin, and bilirubin ditaurate (0, 1, 5, 10, 20, 50, 75, 100, 250 and 500 µM for heme and bilirubin (B,C), or 500 µM for biliverdin and bilirubin ditaurate (A)) and membrane permeability monitored by propidium iodide fluorescence. (D) E. faecalis OG1RF was cultured to mid-log phase and exposed to bilirubin, alpha-tocopherol, and CCCP (each 100 µM). DiSC3(5) (1 µM final concentration), a fluorescent compound which increases in intensity when associated with polarized membranes, was supplemented into cultures before quantifying the fluorescence intensity at excitation 622 nm and emission 670 nm. Error bars represent ± one standard deviation, n = 3, and (*) denotes a significant (P≤0.05) difference while (**) denotes a non-significant difference (P>0.05) between treated samples and solvent-treated samples.

