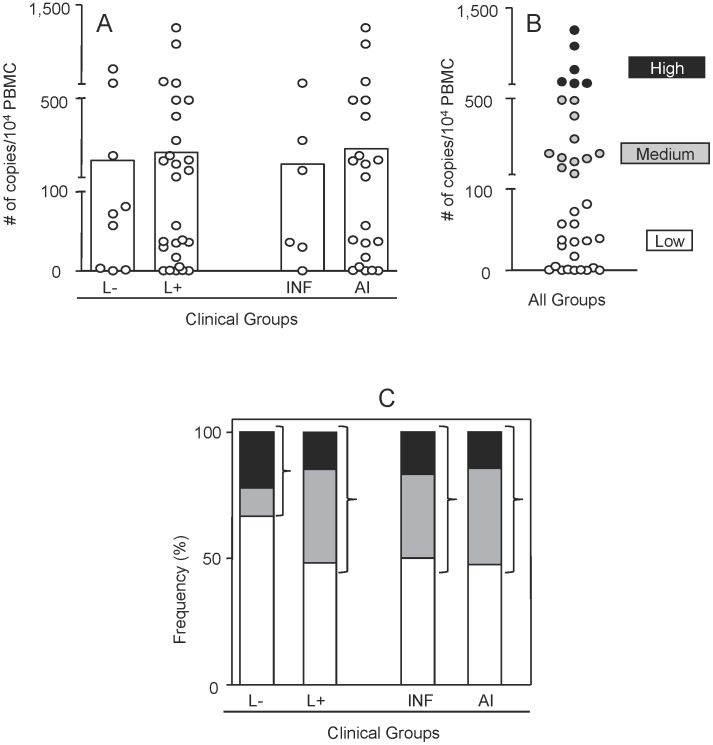
Figure 4. Proviral load of HTLV-1-infected patients without and with infectious or autoimmune skin lesions.
(A) Proviral load was measured by Real Time PCR as described in Materials and Methods and results are expressed in number of HTLV-1 genome copies per 104 peripheral blood mononuclear cells (PBMCs). The frequency of high (black rectangles #6 – 2 without skin lesions and 4 with skin lesions) medium (gray rectangles #11 – 1 without skin lesions and 10 with skin lesions) and low (white rectangles #19 – 6 without skin lesions and 13 with skin lesions) copy number was defined by the global arithmetic mean of all data (B) and individual groups (C).

