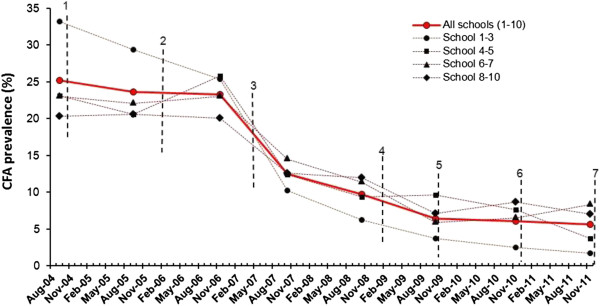
Figure 6.
Effect of six rounds of mass drug administration (MDA) on circulating filarial antigen (CFA) prevalence in Standard 1 children. Thick line = prevalence for all 10 schools combined. Thin stippled lines = prevalence in school clusters according to their location to the south-west (Kirare, Mapojoni and Marungu schools; no. 1-3), north-west (Kiomoni and Mafuriko schools; no. 4-5), close west (Maweni and Kange schools; no. 6-7) and more distant west (Pongwe, Kigandini and Ziwani schools; no. 8-10) of Tanga. Vertical stippled lines indicate rounds of MDA.

