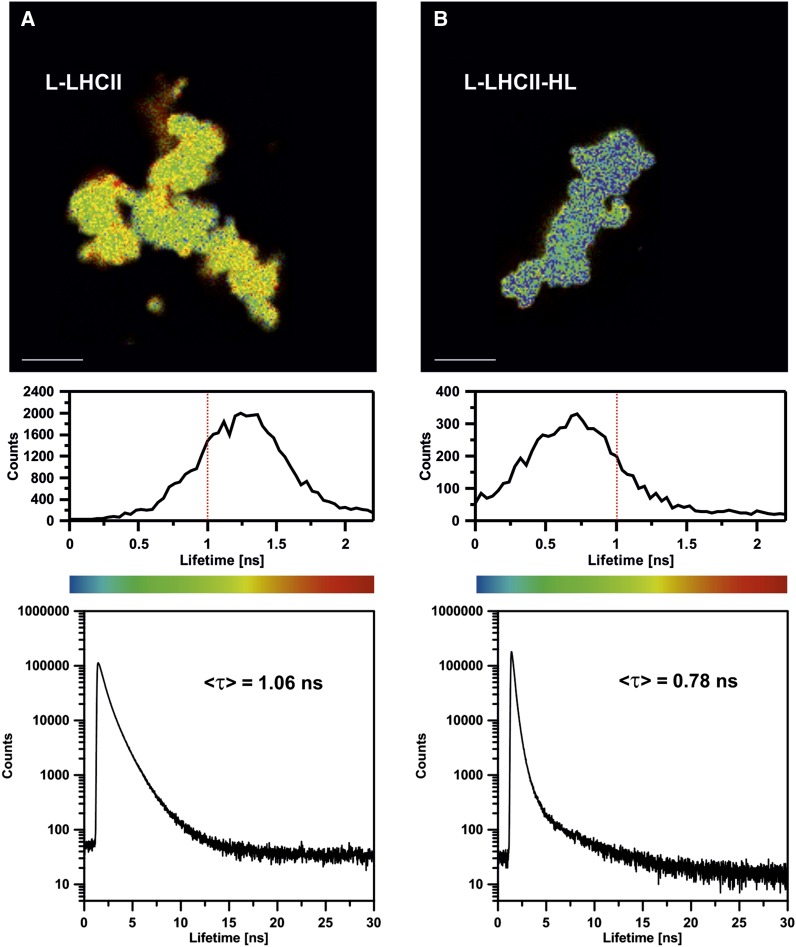
Figure 8.
FLIM Images of the 60 × 60-μm Areas of the Glass Slides Covered with Poly-l-Lys, on Which L-LHCII and L-LHCII-HL Particles Were Deposited from the Aqueous Suspensions of the Samples Diluted to Micromolar Concentration of LHCII.
Fluorescence lifetime distribution (middle panel) and fluorescence decay traces (bottom panel) were presented below each image. The intensity-weighted average lifetimes (<τ>) of each scanned sample are displayed, based on the three component deconvolution: 0.49, 1.19, and 3.78 ns (χ2 = 1.003) in the case of L-LHCII and 0.24, 0.59, and 3.78 ns (χ2 = 1.044) in the case of L-LHCII-HL. Lifetime threshold corresponding to 1 ns is marked in histograms by red dashed line. Bars = 10 μm.

