Figure 9.
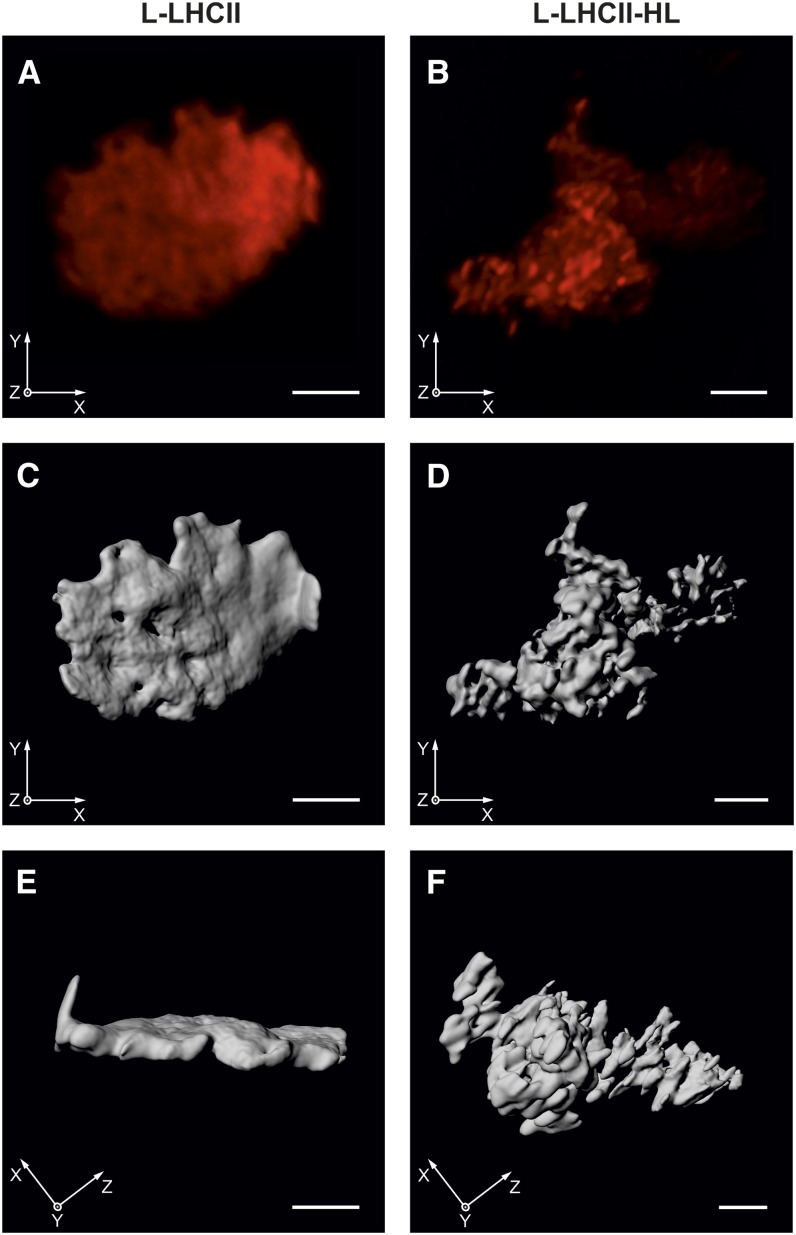
Chlorophyll a Fluorescence of Lipid-LHCII Samples Revealed by CLSM and Subsequent 3D Reconstruction.
The L-LHCII (A) or L-LHCII-HL (B) samples were incubated in buffered medium containing 10 mM KCl. Each red image presents the sum projection of deconvolved stack of CLSM. Gray images represent three-dimensional models of the L-LHCII ([C] and [E]) or L-LHCII-HL ([D] and [F]) created after deconvolution. Face ([C] and [D]) and rotated ([E] and [F]) view of three-dimensional sample models is shown. Bars = 2 μm.
[See online article for color version of this figure.]

