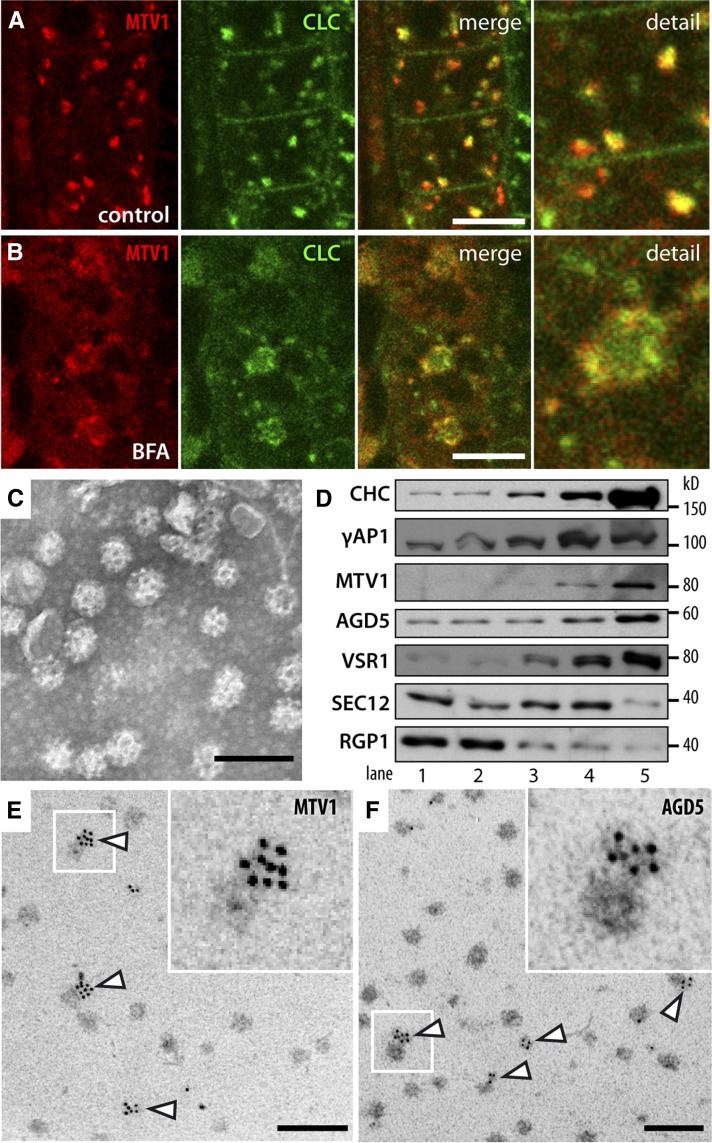
Figure 7.
MTV1 and NEV/AGD5 Are Associated with CCVs.
(A) Live-cell imaging of root epidermal cells harboring MTV1-mCherry (in red) and CLC-GFP reveals partial overlap in the cell interior but not at the plasma membrane.
(B) After 1 h treatment with 50 µM BFA, MTV1-Cherry and CLC-GFP localize to the periphery of the BFA core.
(C) Purification of CCVs from Arabidopsis T87 cell cultures and electron microscopy image of purified fraction.
(D) Immunoblot analysis of enriched CCV fractions; 3 µg of protein was loaded in each lane. 1, Cell homogenate; 2, 30,000g supernatant; 3, Suc step gradient load; 4, linear D2O/Ficoll gradient load; 5, final enriched CCV fraction. Antibodies used: CHC, AP1γ-subunit (γ AP1), MTV1, NEV/AGD5, VSR1, SEC12 (endoplasmic reticulum), and RGP1 (Golgi/cytosolic).
(E) and (F) Immunogold labeling of embedded CCVs using anti-MTV1 (E) or anti-NEV/AGD5 (F) antibodies visualized with gold nanoparticle-conjugated secondary antibodies. Arrowheads point to CCVs with immunogold signal; inset is an enlargement of the region outlined by the white box.
Bars = 500 nm.

