Figure 4.
amsh1-1 Is Deficient in Autophagic Degradation.
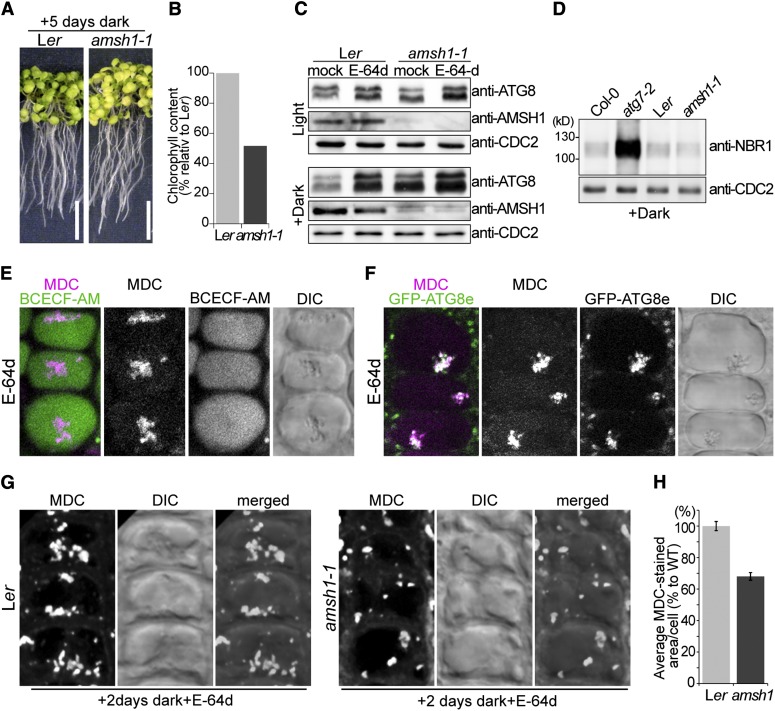
(A) Photographs of wild-type (Ler) and amsh1-1 seedlings after 5 d in the dark (left panel). Seedlings were grown 7 d on half-strength MS under long-day conditions before transfer to dark. Note that starvation-induced chlorosis is enhanced in amsh1-1 compared with the wild type. Bars = 1 cm.
(B) Total chlorophyll content of seedlings in (A). Value of the wild type was set to 100%.
(C) Immunoblot with an anti-ATG8 antibody. Total proteins were extracted from seedlings grown in light for 12 d (Light, top panel) or as in (A) (Dark, bottom panel) before treatment with either DMSO (mock) or E-64d.
(D) Total proteins were extracted from seedlings grown as in (A) and subjected to immunoblot with an anti-NBR1 antibody. atg7-2 is used as a positive control and CDC2 is used as loading control.
(E) Confocal images of MDC-stained wild-type root epidermal cells. BCECF-AM was used to visualize the vacuoles. Seedlings were grown as in (A) and treated with E-64d for 1 h before staining with MDC. Note that upon E-64d treatment, MDC positive autophagic bodies accumulate in the BCECF-AM–stained vacuole.
(F) Confocal images of MDC-stained GFP-ATG8e–expressing root epidermal cells. Seedlings were grown as in (A) and treated 6 h with E-64d before staining with MDC.
(G) Wild-type (Ler) and amsh1-1 seedlings were grown as in (A). Seedlings were subsequently treated with E-64d for 1 h and stained with MDC. Confocal images (maximal projection) of MDC-stained root epidermal cells of the wild type (Ler, left panel) and amsh1-1 (right panel) are shown.
(H) Quantification of MDC-staining positive area per cell in the wild type (Ler) and amsh1-1 (n = 831 for Ler and n = 749 for amsh1-1). Photographs taken in (G) were analyzed by the FluoView software, and the values of the wild type were set to 100%. Error bars indicate se.

